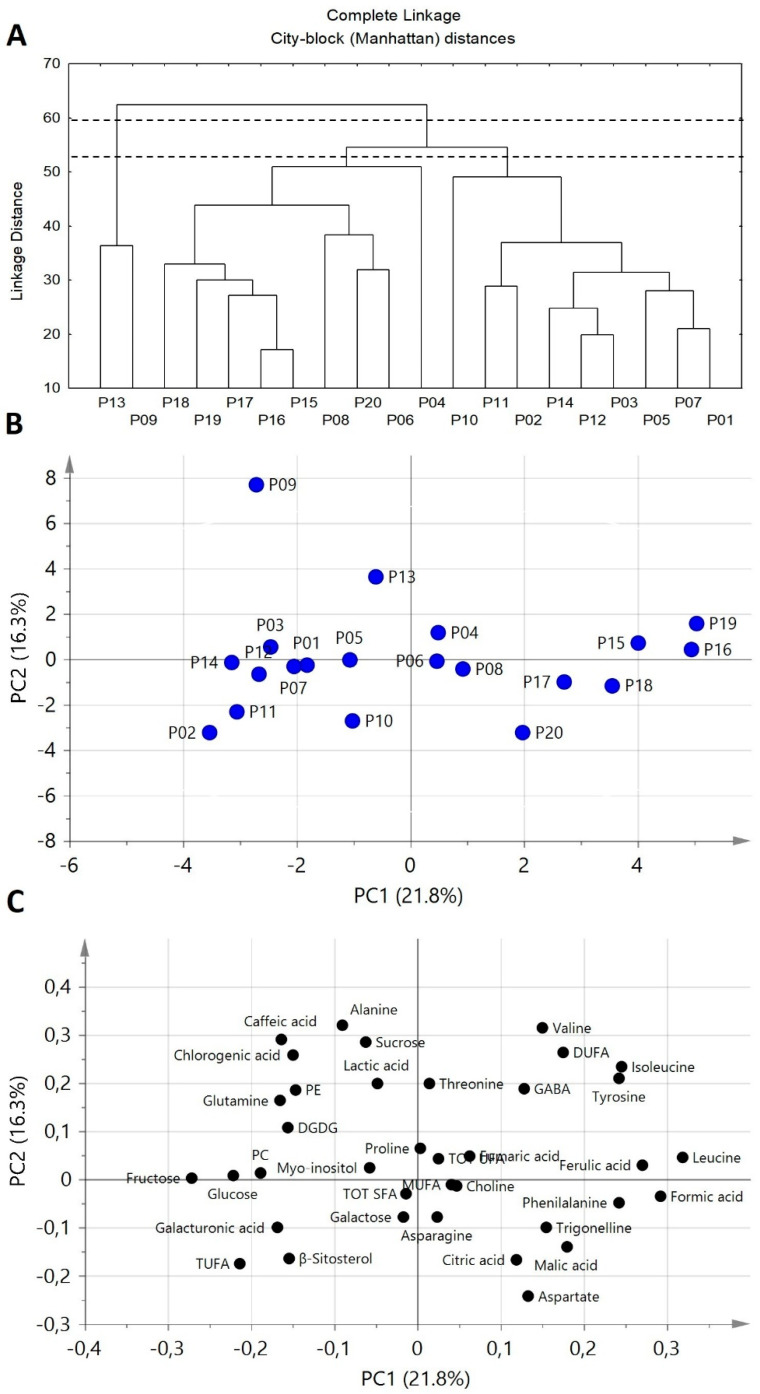
Figure 5.
TCA (Tree Clustering Analysis) and PCA (Principal Component Analysis) applied to NMR and HPLC data relative to twenty potato cultivars (see Material and Methods section). Dendrogram (TCA) cut on two levels (A). PCA maps of potato sample scores (B) and loadings (C). PC1 and PC2 represent 21.8% and 16.3% of the total variance, respectively.

