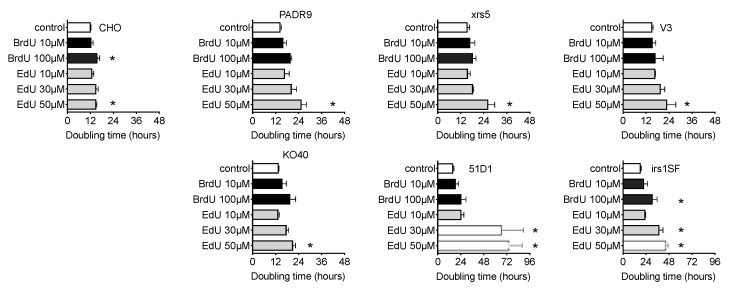
Figure 6.
Cell doubling time and growth delay with BrdU and EdU treatment. CHO and DNA repair-deficient cells were grown with or without BrdU or EdU. Open bars indicate control. Black bars indicate BrdU treatment. Grey bars indicate EdU treatment. Error bars represent the standard error of the mean of three independent experiments. One-way ANOVA, Dunnett’s Multiple Comparison Test was performed to provide p-values. (*) denotes significance against control within each cell group (p < 0.05).

