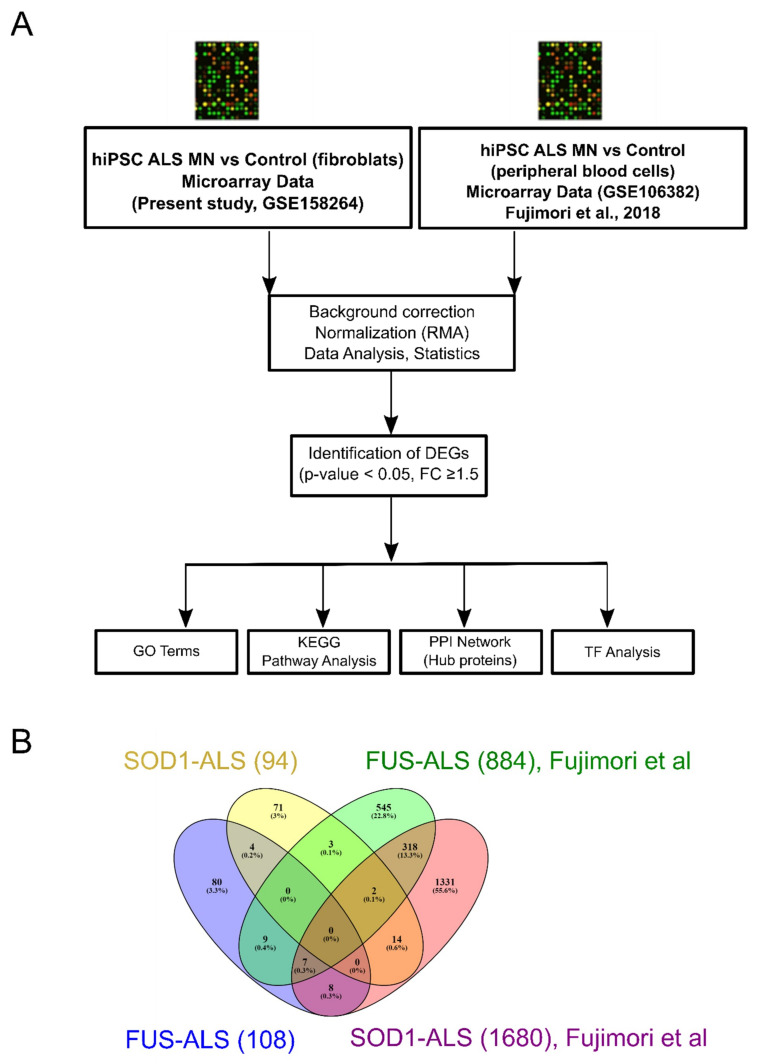
Figure 1.
Overall comparison showed no common genes when comparing all datasets. (A) Workflow of the study. (B) Venn diagram representing all possible combinations of differentially expressed genes (DEGs) across FUS- and SOD1-ALS datasets (present study (GSE158264) and GSE106382). Of note, no common “ALS” DEGs were identified when comparing all datasets.

