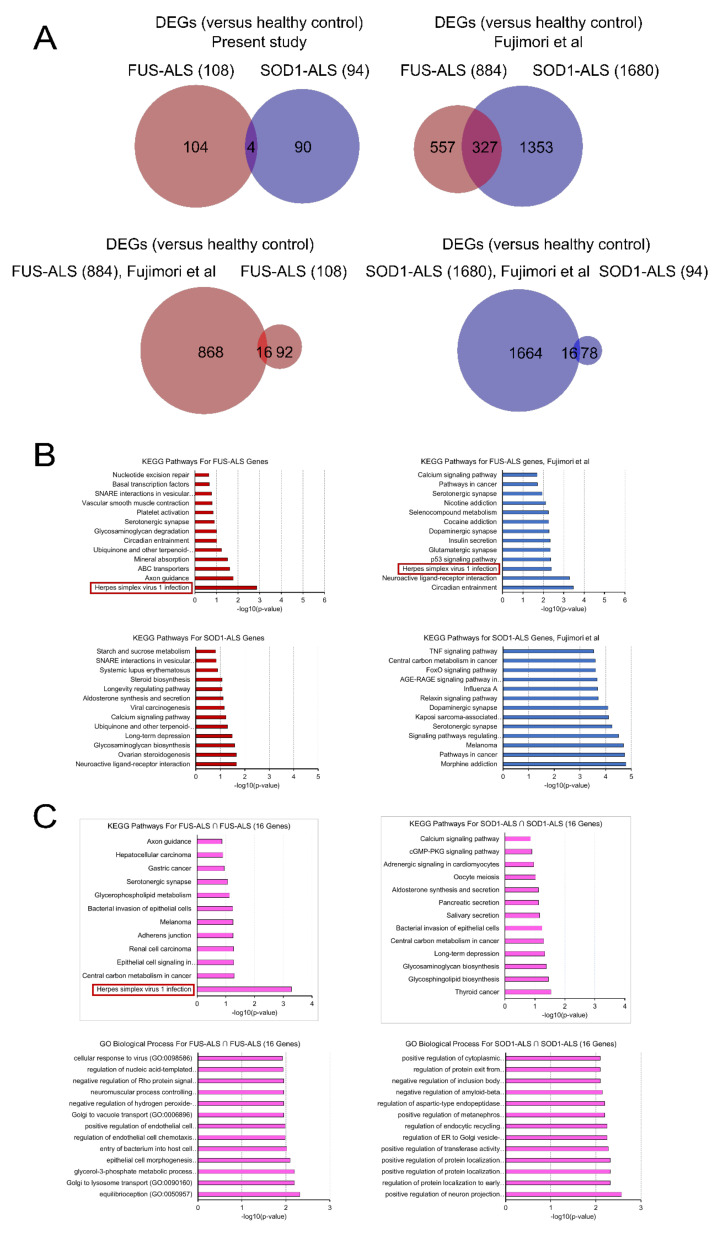
Figure 2.
Comparative pathway analysis between the two datasets. (A) Venn diagrams showing the number of significantly dysregulated genes in each disease (FUS- and SOD1-ALS) and the observed overlap across comparisons. (B) KEGG pathways that are significantly enriched in DEGs specific for each FUS-ALS (upper part) and SOD1-ALS (lower part) disease. (C) The significant KEGG pathways (upper part) and Gene Ontology (GO) analysis of biological processes (lower part) enriched by the DEGs shared between FUS-ALS and SOD1-ALS (present study vs. GSE106382) respectively. X-axis represents the statistical significance of the enrichment (-log10(p-value)). Color coding represents disease subtypes.

