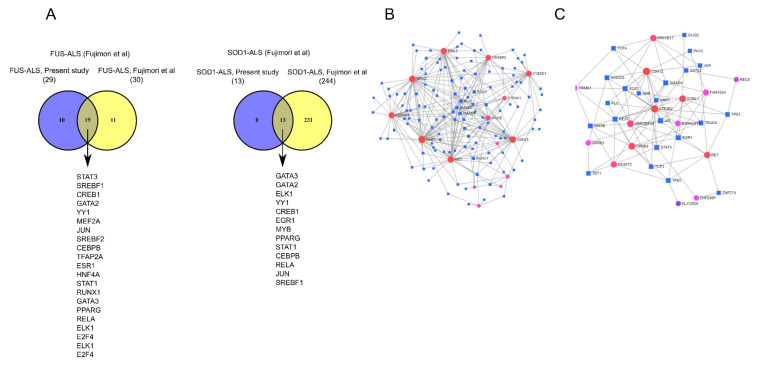
Figure 3.
Transcription factor–DEG regulatory interaction network analysis. (A) Venn diagrams depicting the TFs specific or common among FUS-ALS and SOD1-ALS datasets. (B) Construction of DEG–TF interaction networks based on DEGs identified shared by FUS-ALS datasets (present study vs. GSE106382). (C) Construction of DEG–TF interaction networks based on SOD1-ALS datasets (present study vs. GSE106382) and the minimum connected network was analyzed further. The DEG–TF interaction networks were analyzed in NetworkAnalyst tool [36] (i.e., degree of connectivity and betweenness centrality) and statistical significance score p < 0.05 was used for the construction of networks.

