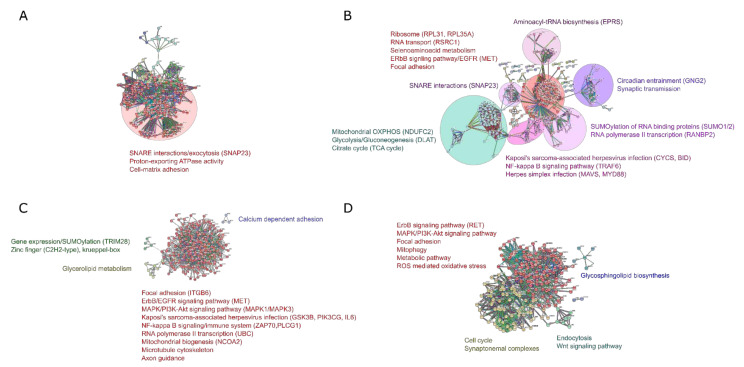
Figure 4.
Protein–protein interaction network analysis revealed novel pathways in different genetic ALS forms. (A) Protein–protein interaction network of the common DEGs shared by FUS- and SOD1-ALS datasets in the present study. (B) Protein–protein interaction network of the common DEGs shared by FUS- and SOD1-ALS in the GSE106382 dataset. (C) Protein–protein interaction network of the common DEGs shared by different FUS-ALS datasets (present study vs. GSE106382). (D) Protein–protein interaction network of the common DEGs shared by different SOD1-ALS datasets (present study vs. GSE106382). The nodes indicate the DEGs and the edges indicate the interaction between two proteins. The STRING database [40] was used to establish functional associations among the known and predicted proteins using annotated DEGs as queries for FUS- and SOD1-ALS interaction network, with a highest confidence score of >0.9 (STRING scores > 0.900) and a maximum number of interactions of to top 200 (direct and indirect). The interacting proteins have been clustered (MCL clustering, inflation = 1.5) based on their functions and associations to select the most significant functional clusters or sub-networks. To identify the highly interacting hub genes, we visualized the protein–protein interaction network using NetworkAnalyst tool [36] and analyzed the topological parameters of these nodes (node degree ≥ 15). Clusters of functionally related nodes were manually circled and labelled. Disconnected nodes were omitted. The significant hub genes according to degree and betweenness centrality, with the maximum number of connections in the common DEGs network, are highlighted in brackets. The networks having the p-values < 0.05 are shown in the network.

