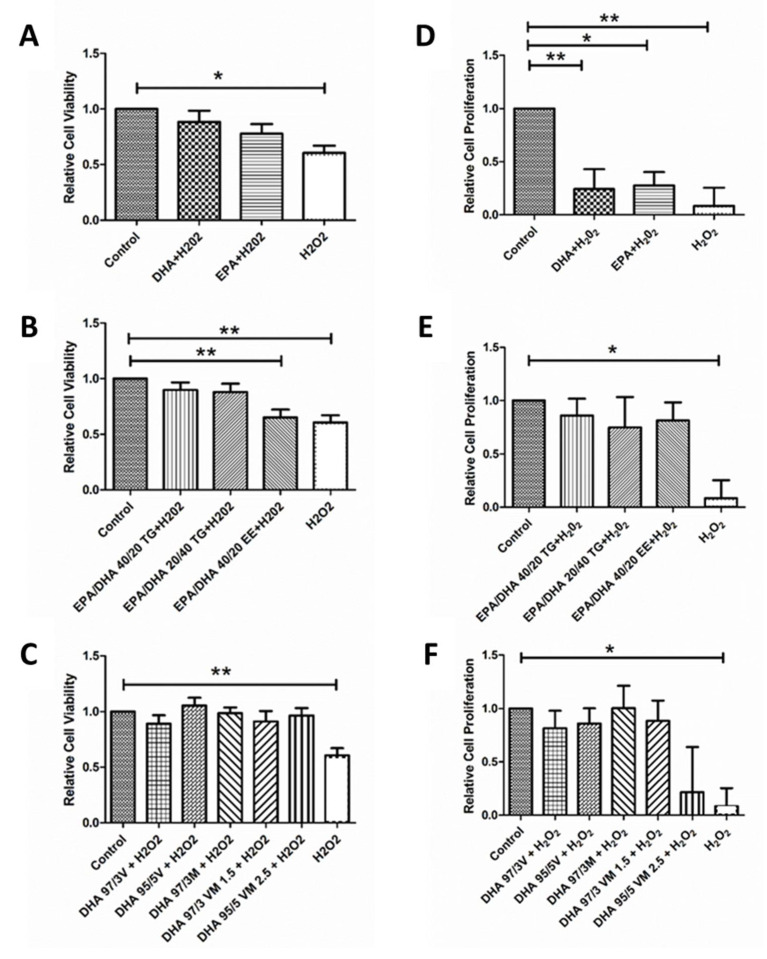
Figure 3.
Graphs showing relative cell viability (A–C) and proliferation (D–F) results for ARPE-19 cells treated with different DHA and EPA treatments groups under oxidative stress conditions (H2O2 For comparisons, one-way ANOVA with the Bonferroni post-hoc test were used. Data are expressed as mean ± SEM. * p < 0.05 and ** p < 0.01. EPA: Eicosapentaenoic acid; DHA: Docosahexaenoic acid; TG: Triglycerides; EE: Ethylesters; PL: Phospholipids. V: Vegetable. M: Marine.

