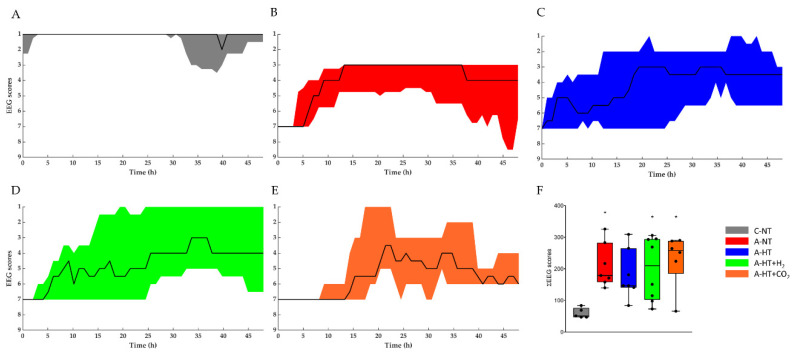
Figure 5.
The EEG recordings were scored using a previously published [14] amplitude-based scoring system (Table S1), where higher scores represent progressive deterioration of electrical activity. Experimental groups: control-normothermia (C-NT), asphyxia-normothermia (A-NT), asphyxia-hypothermia (A-HT), A-HT supplemented with H2 (A-HT + H2) or CO2 (A-HT + CO2), respectively. (A–E): The black line shows the median values whereas the shaded area represents the 25th-75th interquartile range. C-NT animals were characterized by continuous EEG activity and low EEG scores during the entire experiment, whereas asphyxia induced isoelectric EEG that was followed by slow regeneration of electrical activity in all experimental groups in the observation period. There were no significant differences among the treatment groups at any time points; however, the large intra-individual variability can be appreciated. (F): The sum of EEG scores during the observation period in the experimental groups. The black line represents the median, the box the interquartile range, the whiskers the 10th-90th percentiles, the bullets the raw values. The summated EEG scores were significantly higher in the A-NT, A-HT + H2, and A-HT + CO2 asphyxia groups compared to the C-NT (* p < 0.05) group, but this was not the cause in the A-HT group, suggesting that the best outcome was found in these animals.

