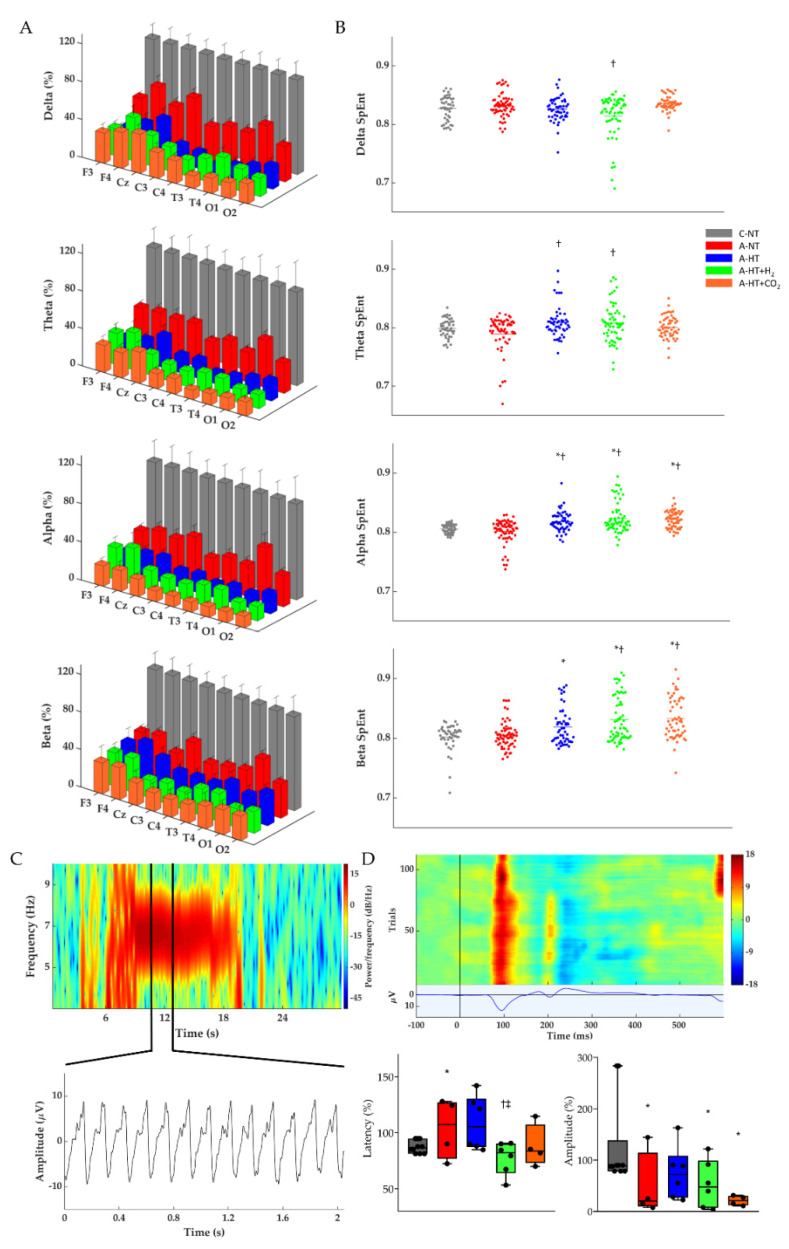
Figure 6.
(A) Average power spectral density (PSD) changes in each experimental group for the four main frequency bands at the end of the 48 h observation period. All PSDs were normalized to their respective control values for each lead. Delta, theta, alpha, and beta PSDs across the different leads show significant differences between each group. (B) Corresponding individual spectral entropy (SpEnt) values in each group. (C) Representative spectrogram of a generalized seizure in a piglet from the asphyxia-normothermia group (~7 Hz) which could be detected by all 9 leads. Below the spectrogram, we highlighted a 2 s-long spike-and-wave seizure waveform. (D) Representative heat map of the recorded VEP trials with their average VEP waveform below. The two box plots show the latency and peak amplitudes of the P100 components at the 48 h time point in each group, normalized to the respective pre-asphyxia baseline values. The black line represents the median, the box the interquartile range, the whiskers the 10th–90th percentiles, the bullets the raw values. Experimental groups: control-normothermia (C-NT), asphyxia-normothermia (A-NT), asphyxia-hypothermia (A-HT), A-HT supplemented with H2 (A-HT + H2) or CO2 (A-HT + CO2), respectively. Data are mean ± SD; * vs. C-NT, † vs. A-NT, ‡ vs. A-HT, p < 0.05.

