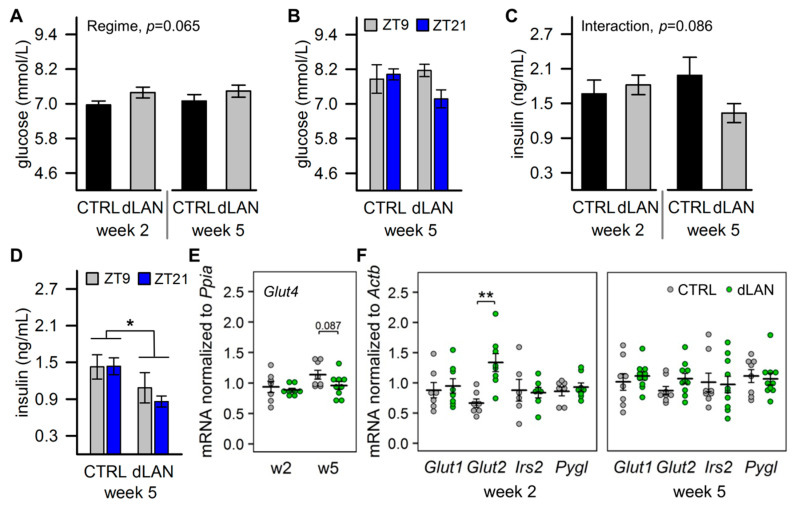
Figure 2.
Dim light at night (dLAN) increases glucose uptake into the liver. (A–D) Plasma glucose (A,B) and insulin (C,D) levels in rats exposed to either the control LD regime (CTRL) or dLAN (~2 lx) for 2 (w2) and 5 (w5) weeks. Blood samples were collected either (A,C) after decapitation between Zeitgeber time 3 (ZT3) and ZT6 or (B,D) from a tail vein at ZT9 and ZT21. Data represent the mean ± SEM. CTRL (n = 7–8 rats) and dLAN (n = 7–10 rats) groups were compared with two-way ANOVA. * p < 0.05. (E,F) Relative mRNA levels of genes involved in glucose transport in the epididymal fat pad (E) and in glucose transport, insulin signaling, and glycogen pathway in the liver (F). Data are shown as dot plots with the mean (thick horizontal lines) ± SEM (error bars). CTRL and dLAN groups were compared with the Student’s t-test or the Mann–Whitney U test. ** p < 0.01.

