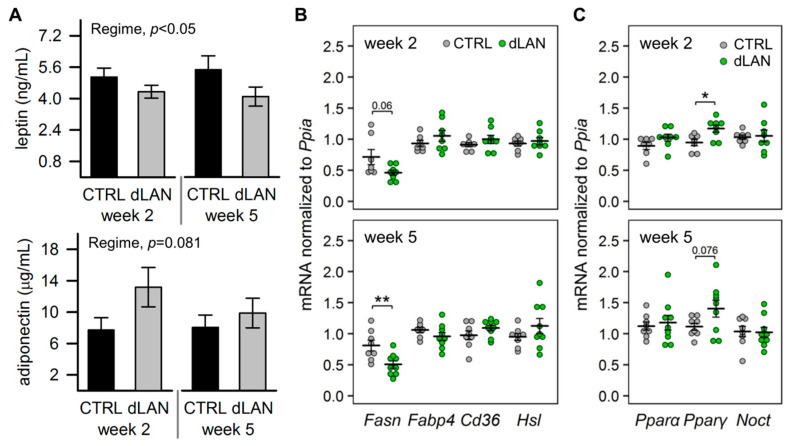
Figure 3.
Dim light at night (dLAN) affects lipid metabolism in the white adipose tissue. (A) Plasma leptin and adiponectin levels in rats exposed to either the control LD regime (CTRL) or dLAN (~2 lx) for 2 and 5 weeks. Data represent the mean ± SEM. CTRL (n = 7–8 rats) and dLAN (n = 7–10 rats) groups were compared with two-way ANOVA. (B,C) Relative mRNA levels of lipogenic and lipolytic genes (B) and metabolic transcription and post-transcription regulators (C) in the epididymal fat pad. Data are shown as dot plots with the mean (thick horizontal lines) ± SEM (error bars). CTRL and dLAN groups were compared with the Student’s t-test. * p < 0.05, ** p < 0.01.

