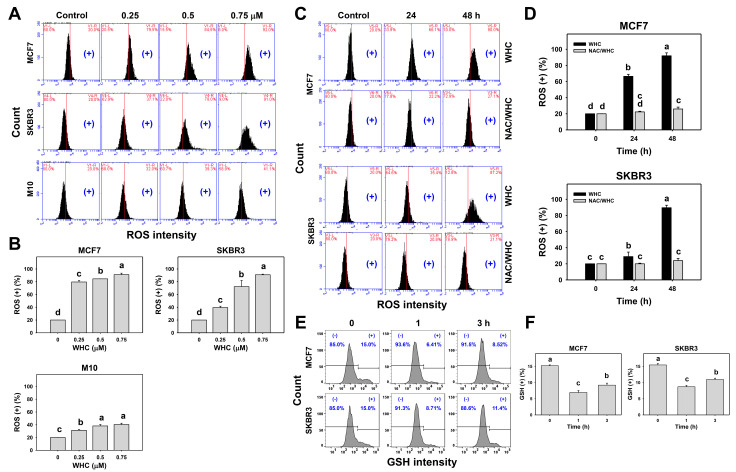
Figure 4.
WHC differentially induced reactive oxygen species (ROS) generation among breast cancer and normal breast cells. (A,B) ROS profiles and statistics for dose effects to WHC. Breast cancer (MCF7 and SKBR3) cells and normal breast (M10) cells were treated with WHC (control (0.075% DMSO), 0.25 0.5, and 0.75 μM) for 48 h. (+) located at the right side of each profile is counted for ROS (+) (%). (C,D) NAC pretreatment reversed the WHC induced ROS generation. Following pretreatments with NAC (10 mM for 1 h), cells were treated with control (0.075% DMSO) and 0.75 μM of WHC for 0, 24, and 48 h, i.e., NAC/WHC. (E,F) GSH profiles and statistics for time course changes to WHC. Breast cancer MCF7 and SKBR3 cells were treated with WHC (control (0.075% DMSO) and 0.75 μM) for 0, 1, and 3 h. (+) located at right side of each profile is counted for GSH (+) (%). Data, means ± SDs (n = 3). Results marked without overlapping letters show significant differences (P < 0.05 to 0.0001).

