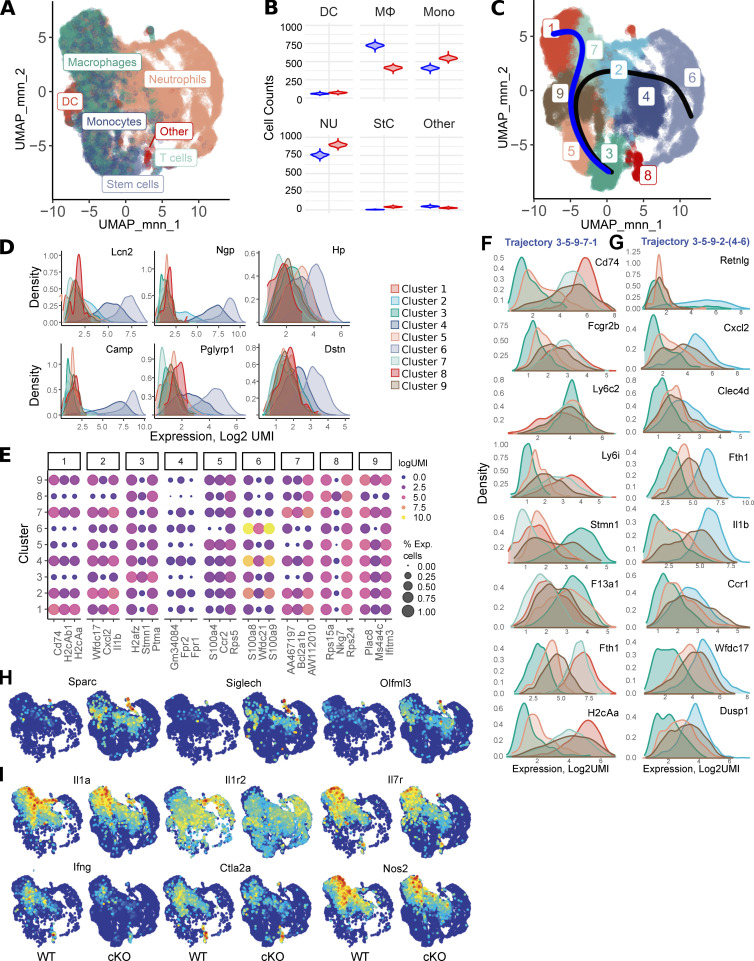
Figure 6.
scRNAseq of spinal cord myeloid cells isolated from WT and GRIP1-cKO mice at EAE DPI20. (A) singleR automated cell type assignment for 20,376 spinal cord–derived myeloid cells. (B) Bootstrapping analysis (see Materials and methods) of singleR cell type (from A) distribution, stratified by genotype: WT = blue; GRIP1-cKO = red. (C) Louvain clustering results and singleR trajectory inference for 20,376 spinal cord–derived myeloid cells mapped onto a UMAP plot. (D) Expression of neutrophilic markers, stratified by Louvain clusters. The color of expression profiles corresponds to Louvain clusters in C. (E) Bubble plot of top three cluster-specific markers (from C), with the circle size representing the percentage of expressing cells and the color corresponding to logUMI. (F and G) Expression of select genes along the (F) 3–5-9-7-1 (C, blue line) and (G) 3–5-9-2-4-6 (C, black line) trajectories. The color of expression profiles corresponds to Louvain clusters in C. (H and I) Expression of homeostatic MG (H) or inflammatory (I) markers mapped onto a UMAP plot, stratified by genotypes. DC, dendritic cells.

