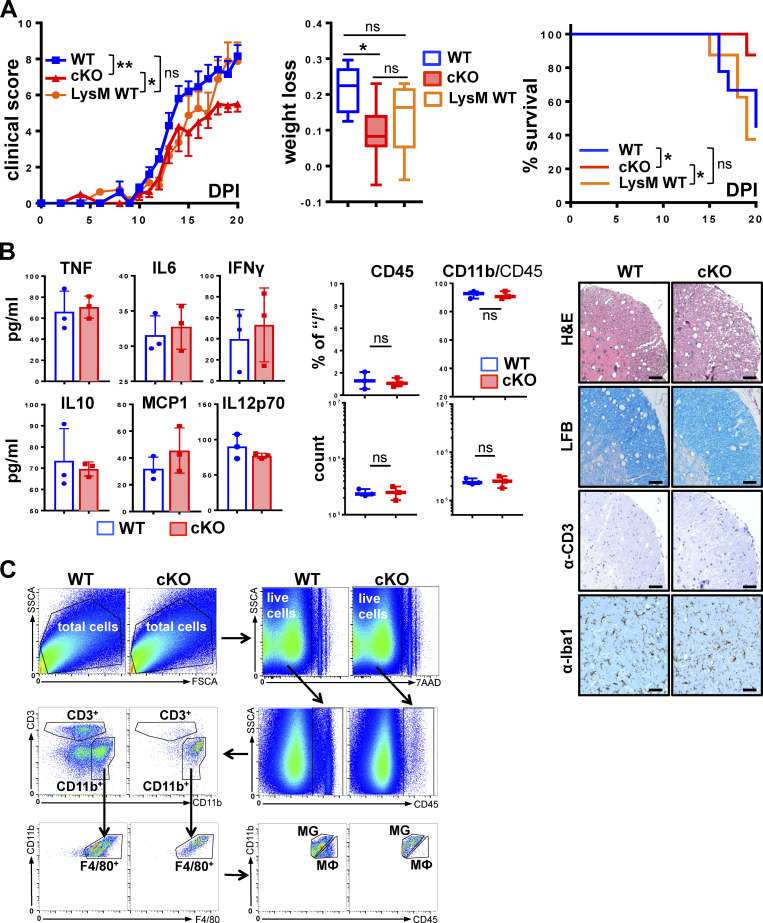
Figure S2.
Disease severity is independent of Cre expression, and homeostatic GRIP1-cKO mice display no apparent phenotype. (A) Clinical scores were determined daily following EAE induction in eight WT, nine LysM WT, and seven cKO mice and plotted as mean ± SEM (Kruskal-Wallis test with Dunn’s multiple comparisons test at DPI20). The fraction of weight lost by DPI20 was assessed in WT, LysM WT, and cKO mice as in Fig. 1 B (Kruskal-Wallis test with Dunn’s multiple comparisons test at DPI20). Survival distribution was plotted via Kaplan-Meier curve and compared between strains as in Fig. 1 B (Mantel-Cox test). *, P < 0.05; **, P < 0.01. ns, nonsignificant. (B) Homeostatic age-matched WT and cKO mice (n = 3) were killed, and their blood was collected by cardiac puncture. Serum concentrations of indicated inflammatory cytokines were measured using CBA as in Fig. 1 C. Spinal cord lumbar sections from age-matched WT and cKO mice were analyzed as in Fig. 2 A by H&E staining for inflammatory foci, LFB staining for myelin, immunohistochemistry for CD3+ T cells, and Iba-1+ for MG and MФ. Scale bar is 100 µm. FACS analysis of leukocytes isolated from spinal cords of WT or cKO mice (n = 3) is plotted as a percentage of the gated parent population and total counts. (C) FACS gating strategy for all experiments. Cells were purified from spinal cords of WT and GRIP1-cKO mice with EAE and separated from myelin using Percoll gradient. From total selected cells, live (7-AAD−) cells were gated on. Of those, CD45+ cells were gated on as leukocytes and separated into two populations: CD3+ T cells and CD11b+ cells containing B cells, myeloid cells, and natural killer cells. The myeloid cell subpopulation expressing F4/80 was regated and divided into Cd11b+CD45low MG and Cd11b+CD45high MФ. FSCA, forward-scatter area; SSCA, side-scatter area.

