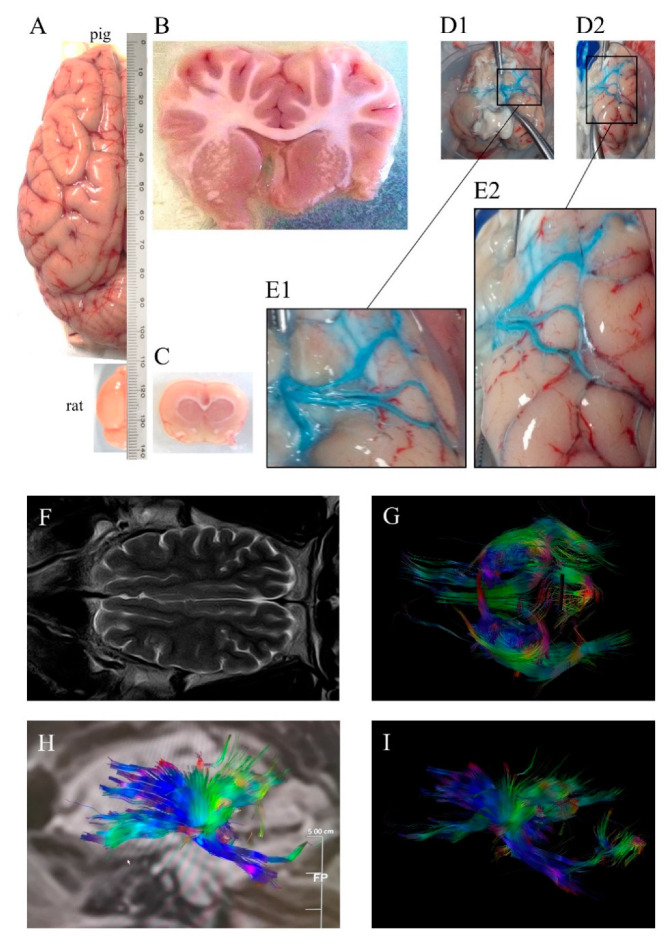
Figure 1.
(A) Dorsal view of pig and rat brain hemispheres showing differences in size and gyrencephaly. Coronal (B) pig and (C) rat sections showing differences in white matter. (D1) Ventral view of pig brain (without cerebellum) injected unilaterally i.a. ex vivo a blue dye, (D2) ventrolateral view of the same brain, (E1) and (E2) magnifications of the insets in (D1) and (D2), respectively, showing three main middle cerebral arteries. (F) Horizontal pig brain section obtained by magnetic resonance T2 sequence, (G) tractography using diffusion tensor imaging (DTI) and (H,I) sagittal pig brain tractography, with colors denoting directionality. Images were obtained at the Comparative Medicine and Bioimage Centre of Catalonia (CMCiB).

