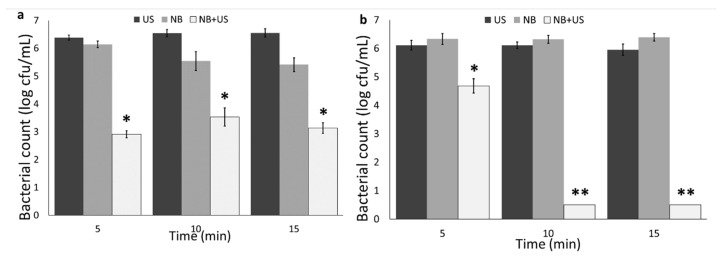
Figure 4.
(a) V. parahaemolyticus and (b) A. hydrophila count in nanobubbles (NB), ultrasound (US), and nanobubbles + ultrasound (NB + US) at different exposure times. Statistical difference was determined based on p < 0.05 (*). Samples with two asterisks (**) were below the limit of detection (0.5 log cfu/mL).

