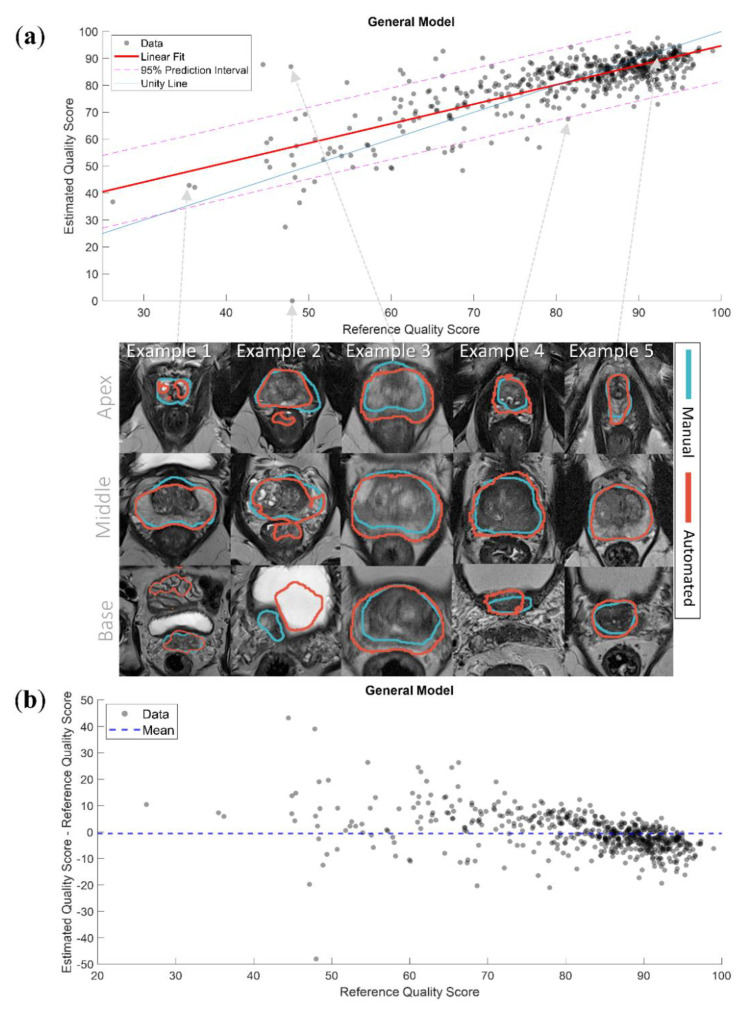
Figure 6.
(a) The linear fit of the estimated quality scores with 95% prediction interval of the General model with examples of segmentations. Example 1 presents a case where the model accurately predicted the quality score (QS) of a low-quality automated segmentation; Example 2 presents a case where the model extremely underestimated the QS of a low-quality automated segmentation, the automated segmentation here covered parts of the rectum and the bladder; Example 3 presents a case where the model extremely overestimated the QS of a low-quality automated segmentation, the manual segmentation here misses the peripheral zone; Example 4 presents a case where the model slightly underestimated the QS of a high-quality automated segmentation, the automated segmentation here was slightly over segmented; Example 5 presents a case where the model accurately predicted the QS of a high-quality automated segmentation; (b) the difference between the estimated and reference quality scores of the General model.

