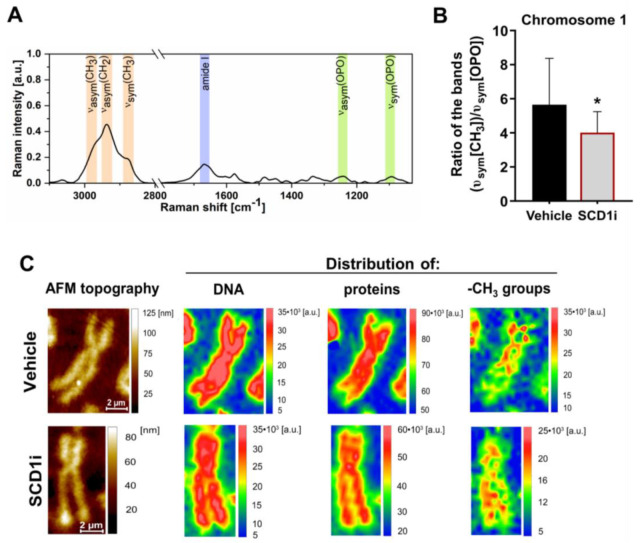
Figure 2.
Raman spectroscopic analysis of the effect of SCD1 inhibition on the spatial distribution of -CH3 groups within single chromosome 1 in INS-1E cells. (A) Average Raman spectrum of chromosomes 1 (n = 15, spectra obtained using empty modeling analysis) that were isolated from INS-1E cells (smoothed, Savitzky–Golay filter, second order, 11 pt). (B) Estimation of global methylation levels in single chromosome 1 from control INS-1E cells and cells that were treated with the SCD1 inhibitor, presented as an average integration value (n = 6) of the band in the spectral range of 2900–2850 cm−1 (υsym(CH3)), corresponding to the distribution of -CH3 groups and normalized to the band in the spectral range of 1110–1070 cm−1 (υsym(OPO)), corresponding to the distribution of DNA. (C) Atomic force microscopy (AFM) and Raman spectroscopic maps of chromosome 1—isolated from INS-1E cells, showing the topography of single chromosome 1 and the spatial distribution of integrated bands, corresponding to the distribution of DNA, proteins (mainly histones), and methyl groups. The data are expressed as mean ± SD. * p < 0.01, vs. vehicle.

