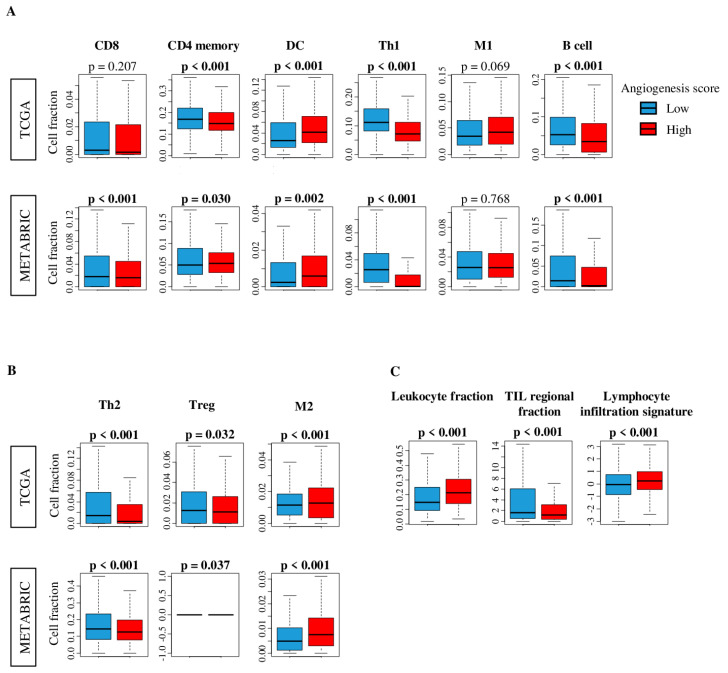
Figure 4.
Comparison of tumor infiltrating immune cells between low (blue) and high (red) angiogenesis score tumors. Boxplots of the comparison with (A) favorable immune cells: CD8, CD4 memory, dendritic cell (DC), T helper type 1 cells (Th1), M1 macrophages, and B cell, and (B) unfavorable immune cells: T helper type 2 cells (Th2), regulatory T cell (Treg), and M2 macrophage by low and high angiogenesis scores in the TCGA and METABRIC cohorts. (C) Comparison of low and high angiogenesis scores in scores of leukocyte fraction, tumor infiltrating lymphocyte (TIL) regional fraction and lymphocyte infiltration of TCGA cohort. The median was used as cut-off to divide into high and low score groups within each cohort. One-way ANOVA test was used to calculate p values. Tukey type boxplots show median and inter-quartile level values.

