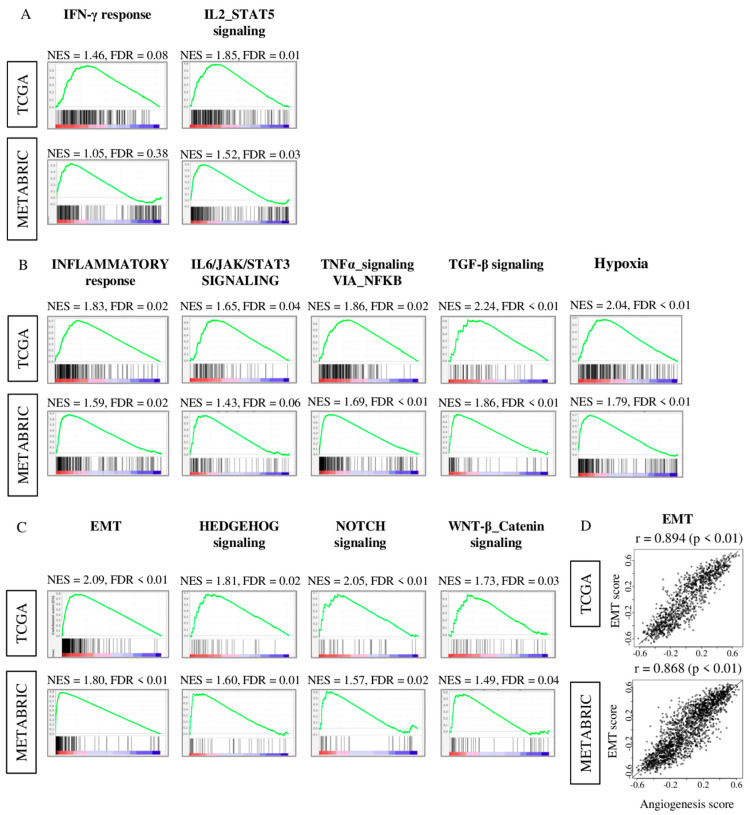
Figure 5.
Gene Set Enrichment Assay (GSEA) comparing low and high angiogenesis pathway score tumors with enrichment gene sets in high angiogenesis pathway score group in both the TCGA and METABRIC cohorts. Correlation plot of (A) immune response gene sets; interferon (IFN)-γ, and IL2-STAT5 signaling, (B) Inflammatory response gene sets; Inflammatory response, IL6-JAK-STAT3 signaling, TNF-α signaling via NFkB, TGF-β signaling and hypoxia, (C) metastasis-related gene sets; epithelial mesenchymal transition (EMT), HEDGEHOG signaling, NOTCH signaling and WNT-β catenin signaling with normalized enrichment score (NES) and false discovery rate (FDR). The median was used as cut-off to divide into high and low score groups within each cohort. (D) Correlation plots of the angiogenesis score and EMT pathway score of both cohorts. p value was analyzed with spearman r correlation.

