
Fig. 4.
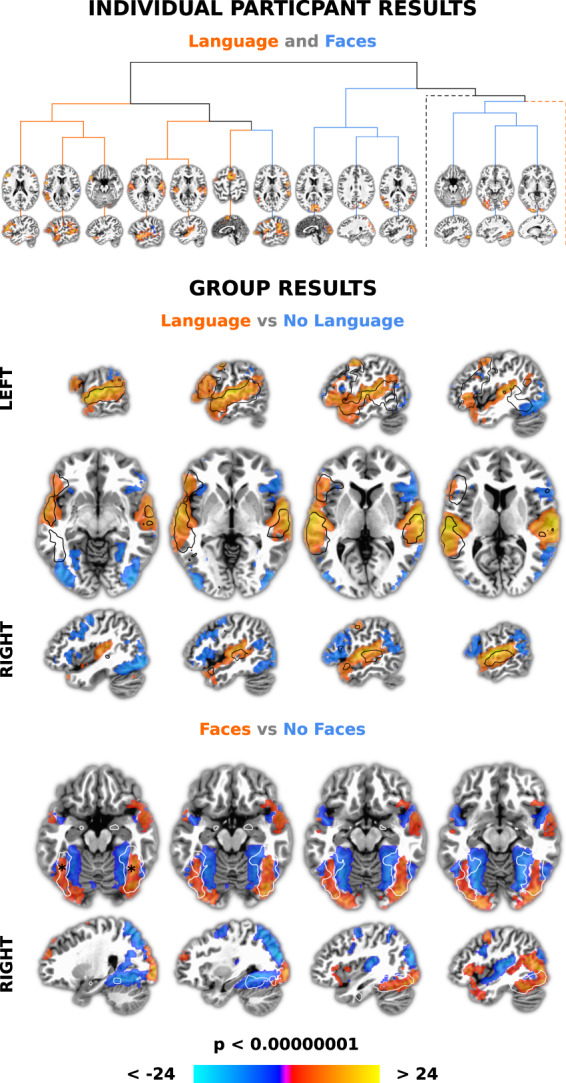
Results of combined independent component analysis (ICA) and model-based analysis demonstrating data quality, timing accuracy and an approach to network labelling. First, networks were found at the individual participant level using ICA, a multivariate data-driven approach. Word and face annotations from movies were then convolved with a standard hemodynamic response function and used in general linear models to find associated IC timecourses. The dendrogram (top) shows 13 of 20 significant networks from an example participant that were more associated with words > no words (‘Language’; red lines) and faces > no faces (‘Faces’; blue lines), clustered to show IC timecourse similarity. Slices are centred around the centre of mass of the largest cluster in each network. Two branches (dotted lines) were excluded for visibility. These had an additional five language and two face networks. For group analysis, spatial components corresponding to significant IC timecourses for each participant were summed and entered into t-tests. The middle panel shows that word > no word networks (‘Language’; reds) overlap a ‘language’ meta-analysis (black outline) more than no word > word networks (‘No Language’; blues). Slices are centred around the centres of mass of the two largest clusters, in the left and right superior temporal plane. The bottom panel shows that face > no face networks (‘Faces’; reds) produced greater activity than no face > face networks (‘No Faces’; blues) in the same areas as a ‘fusiform face’ area (FFA) meta-analysis (white outline). Slices are centred near the average x/y/z coordinates of the putative left and right FFA (indicated with black asterisks). The colour bar represents z-scores in all panels. All individual and group level results were Bonferroni corrected for multiple comparisons and presented with an arbitrary minimum cluster size of 20 voxels.