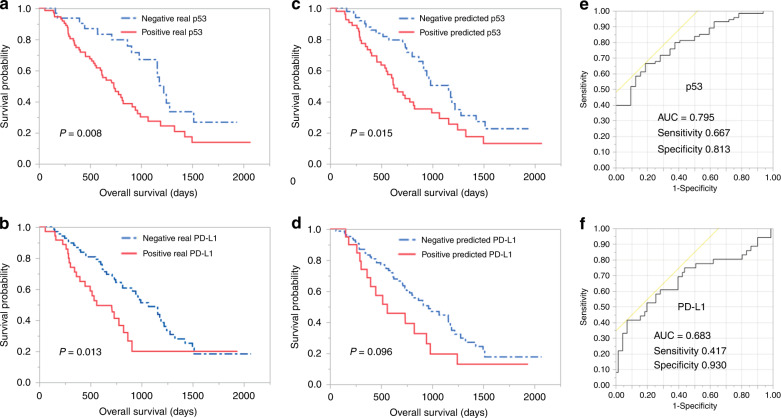
Fig. 3. Kaplan-Meier plots of p53 and PD-L1 status by IHC compared with status by machine-learning, and ROC curve.
Kaplan–Meier plots for patients with PDAC demonstrating prognostic influence for the “real” status (positive/negative) of p53 in IHC (a), PD-L1 in IHC (b) and “predicted” status of p53 (c), PD-L1 (d) with reference to overall survival. ROC curve was constructed by “real” status and “predicted” status of p53 (e) and PD-L1 (f), respectively. “predicted” status was calculated with machine learning and 1037 IFs extracted from CT.

