Figure 3.

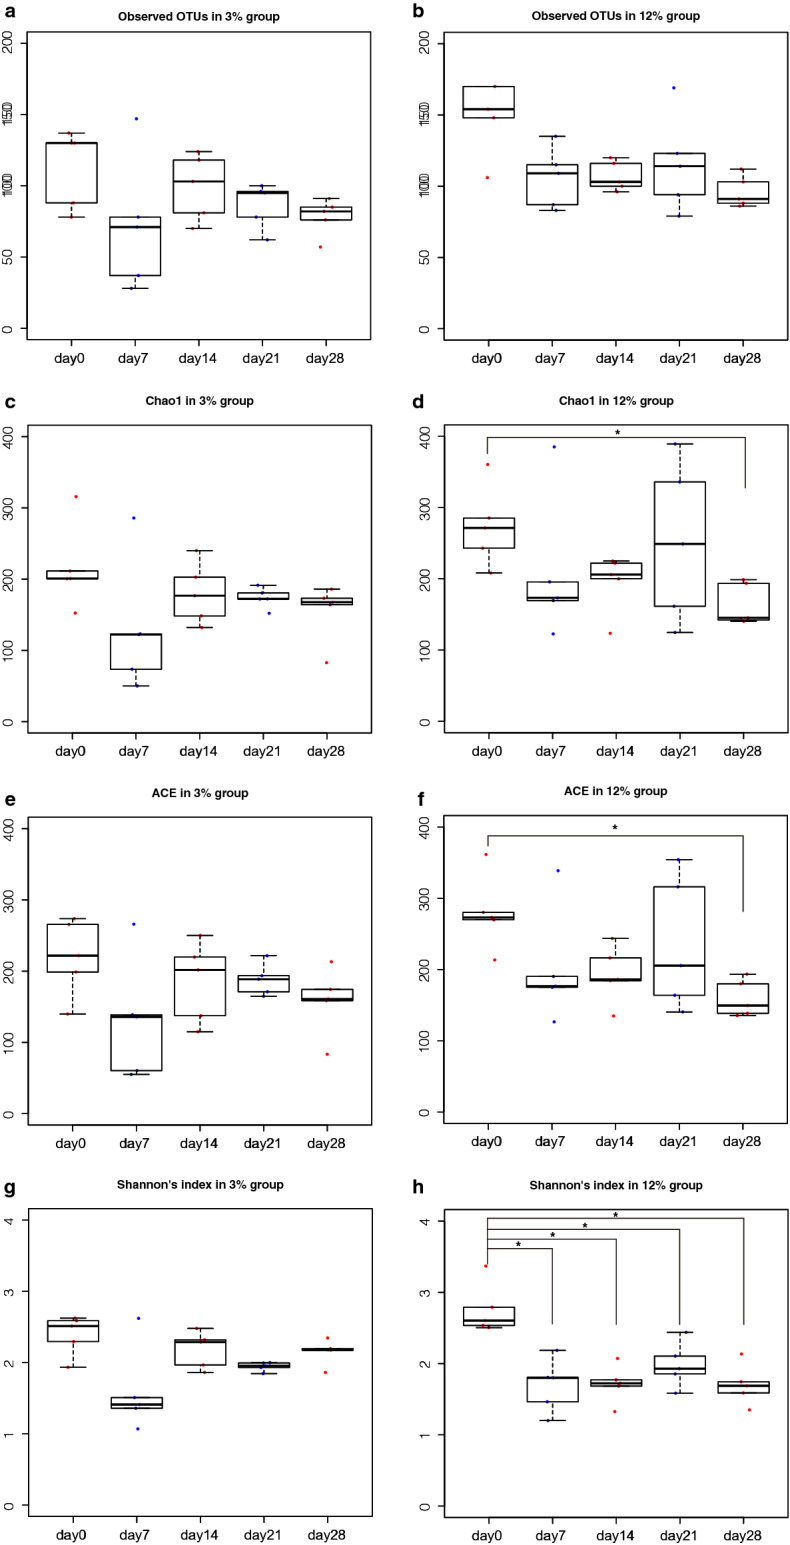
Measures of ɑ-diversity of intestinal microbiota of mice fed 3% and 12% protein diet. The label of data on day 0, 7, 14, 21 and 28, were shown as day 0, day7, day14, day21 and day28 respectively. The symbols * indicates P < 0.05. (a) The box plots of observed Operational taxonomic unit (OTU) number of the intestinal microbiota of mice in the 3% protein group. (b) The box plots of observed OTU number of the intestinal microbiota of mice in 12% protein group. (c) The box plots of Chao1 in the 3% protein group. (d) The box plots of Chao1 in the 12% protein group. (e) The box plots of ACE in the 3% protein group. (f) The box plots of ACE in the 12% protein group. (g) The box plots of Shannon’s index in the 3% protein group. (h) The box plots of Shannon’s index in the 12% protein group.
