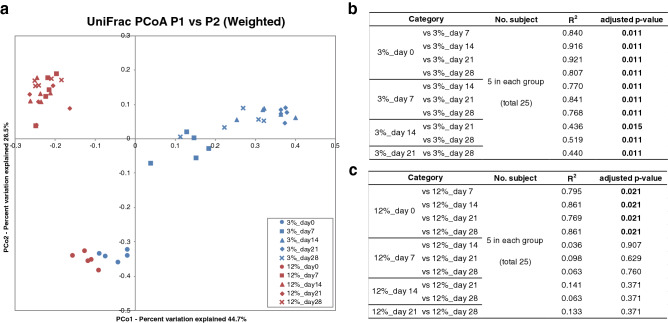
Figure 4.
Measures of ß-diversity of intestinal microbiota of mice fed 3% and 12% protein diet. (a) Principal coordinates analysis (PCoA) plot based on the weighted UniFrac distances for intestinal microbiota composition in mice in each group in the second experiment. Plots of the 3% protein group were shown in blue and those of the 12% protein group were shown in red. (b) Evaluation of dissimilarity of the 3% protein group by PERMANOVA in the analysis of weighted UniFrac distance. R2 indicates coefficient of determination. Significant adjusted P values are in bold. (c) Evaluation of dissimilarity of the 12% protein group by PERMANOVA in the analysis of weighted UniFrac distance. R2 indicates coefficient of determination. Significant adjusted P values are in bold.

