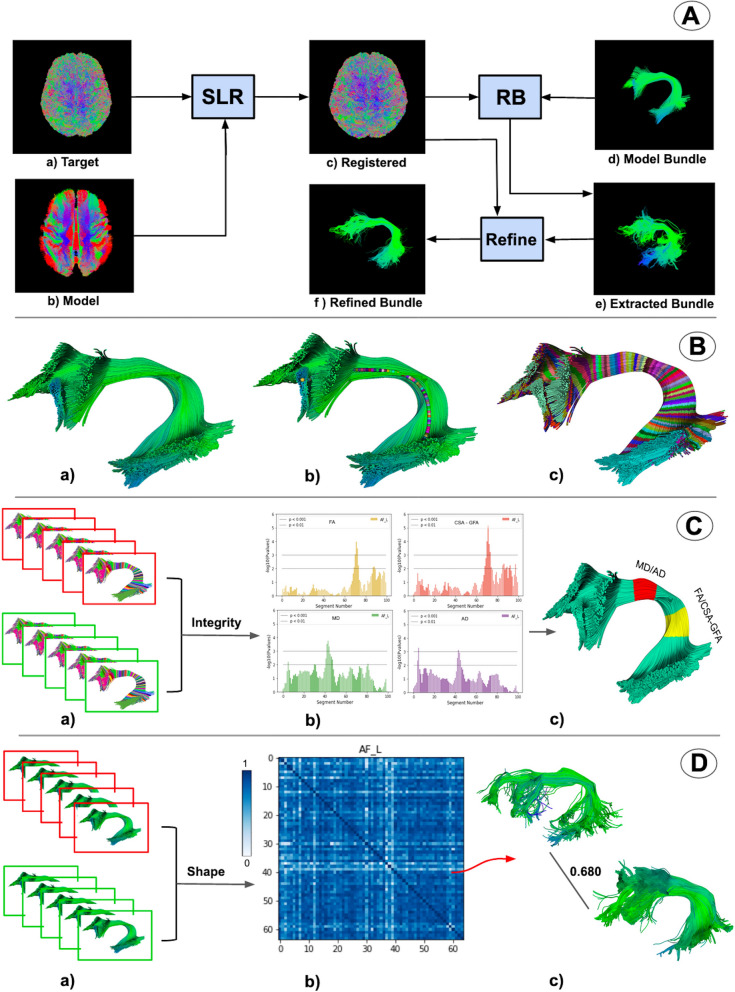
Figure 1.
Overview of bundle analytics (BUAN) framework. (A) shows the process of bundle recognition. (B) shows the process of creating assignment maps (segments) on each extracted bundle. (C) shows the bundle profile analysis concept where groups (red and green) with assignment maps can be used to find statistically significant group differences at specific locations in the bundles. Notice in (C.c) how multiple metrics can be significant in one area (shown with red) and others can be significant in other areas (shown with yellow). Finally (D), shows an example of the network-based bundle shape similarity analysis method of BUAN. In (D.c), a single scalar value [0–1] summarizes the shape differences between the two bundles. The matrix (D.b) provides the complete information of all shape differences in the populations for the the left arcuate fasciculus.

