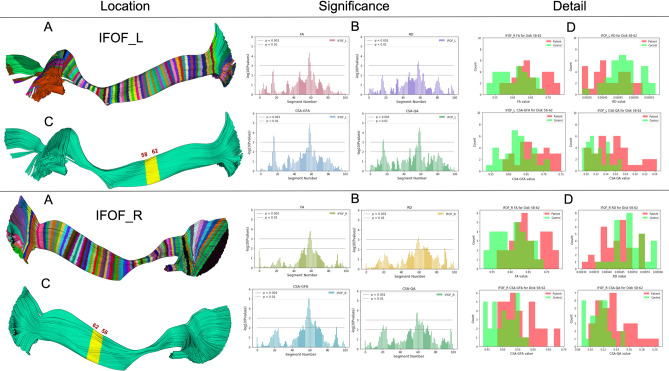
Figure 4.
BUAN can identify the significant areas (middle column), visualize and locate them (left column) and then show why this is happening for the population (right column). Here showing the left (top) and right Inferior Fronto-occipital Fasciculus (bottom). Bundles are divided into 100 segments as shown in (A), each segment is given as an input to linear mixed models (LMM) and the output of LMM identifies significant FA, MD, CSA-GFA and CSA-QA group differences at each segment in (B). The highlighted yellow segment in (C) shows the exact location (58-62 segments) on the bundles where the p value < 0.001. Locations/segments on bundles are selected by using segments with higher significant differences provided by Linear Mixed Models results. Histograms of mean FA, MD, CSA-GFA, and CSA-QA of control (green) and patient (red) groups at specific significant locations of 58 - 62 segments shown in (D) provide additional explanation of the results. Notice how BUAN not only provides significant results but also shows why these differences were brought up in the populations (see right column).

