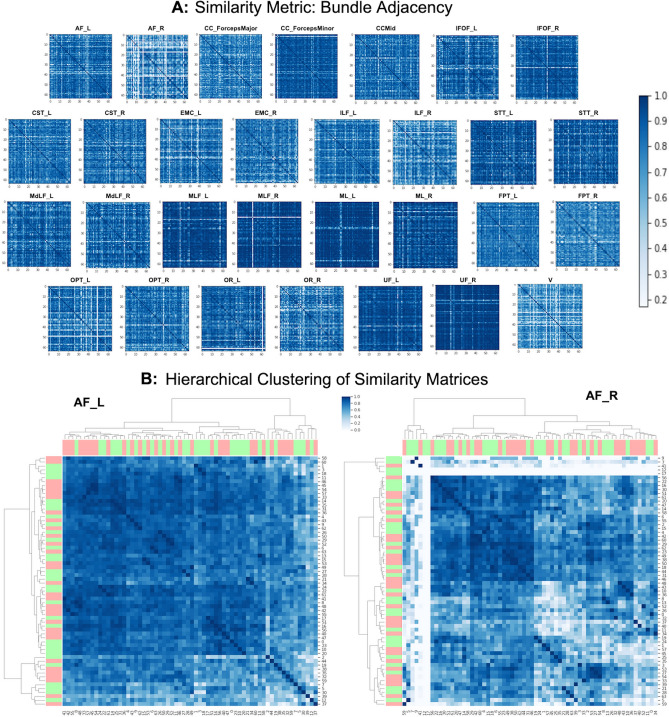
Figure 5.
(A) Similarity matrices for 30 bundles of 64 subjects. The similarity metric used here is bundle adjacency (BA). The first 32 rows represent healthy controls and the last 32 rows belong to patient data. Higher BA value has a darker blue color which signifies higher shape similarity among bundles. Lower BA value which tends to white color signifies lower shape similarity. The diagonal of every matrix is dark blue (BA score of 1) as it is measured against itself. All similarity scores are calculated with the BA threshold of 5 mm. Notice that we can easily identify from these matrices which bundles are less similar in shape by looking at the color of matrices. (B) The hierarchical clustering of similarity matrices of AF are presented. The red bars represent patient observations and green bars represent healthy controls. Notice how the AF_R has overall more white than AF_L. This is expected as the right arcuate fasciculus is not always easily detected in the brains of all individuals.

