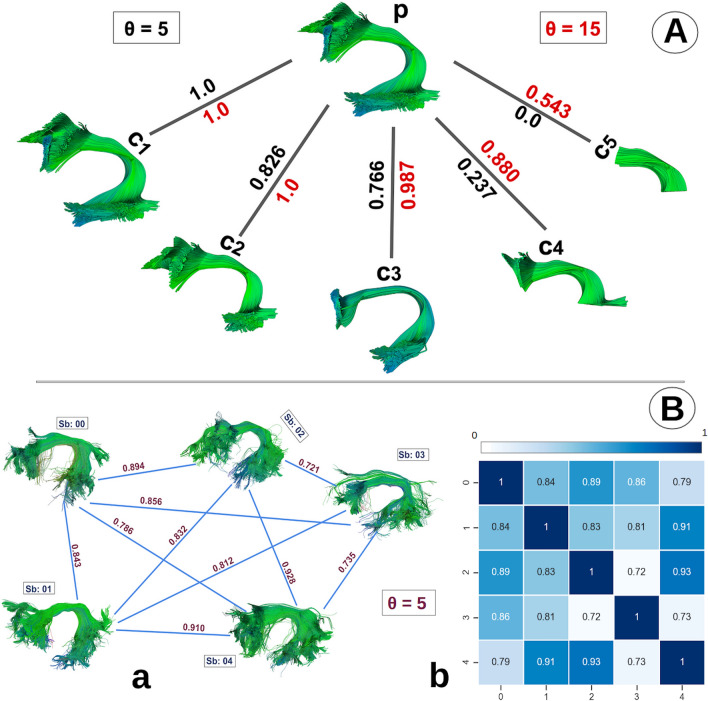
Figure 7.
Bundle-based shape analysis. (A) shows shape similarity among a parent bundle p with 5 children bundles in a tree structure. We calculate shape similarity using bundle adjacency (BA) between parent p (AF_L) and children c1, c2, c3, c4, and c5 which are curated by eliminating parts of the same parent bundle p. The c1 bundle is an exact replica of the p bundle and it has a perfect BA score of 1. BA score changes as we eliminate larger parts of the bundle in child bundles. For c5, we see the least similarity with the BA score of 0 in the case of . We can manage how strict we want our similarity/shape analysis by adjusting the threshold accordingly. The red threshold of 15 mm is lenient while the black threshold of 5 mm is more strict as shown in (A). (B) we can illustrate our shape analysis overview as a fully connected graph with similarity (BA) scores on the edges and the bundles as nodes as shown in (a). We can also visualize it as a similarity matrix (b) where dark blue color means higher shape similarity and white color indicates lower shape similarity.

