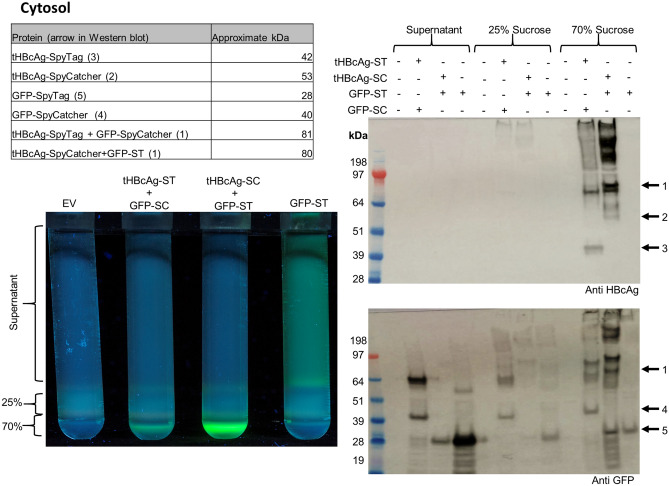
Figure 3.
In vivo conjugation of GFP-ST/SC to tHBcAg-SC/ST VLPs in the cytosol: The table in the top left indicates the approximate expected sizes of conjugated and unconjugated proteins. Bottom left: Fluorescence imaging of 25 and 70% double sucrose cushion. EV pEAQ-HT empty vector control. Unconjugated GFP-ST was mainly detected in the supernatant with some fluorescence in the interface between the 25 and 70% fraction. In the presence of tHBcAg, GFP fluorescence was mainly detected in the 70% sucrose fraction indicating conjugation of VLPs and GFP. Right: Western blot (anti HBcAg = top, anti GFP = bottom). Empty pEAQ-HT vector was used as negative control. Arrow 1 = approximate size of conjugated tHBcAg and GFP (~ 80 kDa). Arrow 2 = unconjugated tHBcAg-SC (~ 53 kDa), arrow 3 = unconjugated tHBcAg-ST (~ 42 kDa), arrow 4 = unconjugated GFP-SC (40 kDa), arrow 5 unconjugated GFP-ST (28 kDa). Unconjugated GFP was mainly detected in the supernatant while tHBcAg was detected in the 70% sucrose fraction. Presence of ~ 80 kDa bands (arrow 1) in 70% fraction in both Western blots indicated successful conjugation of GFP and VLPs. Negative control (EV) shows that all bands are specific for HBcAg or GFP respectively. Blots cropped for clarity, for uncropped blots see Supplementary Fig. S2.

