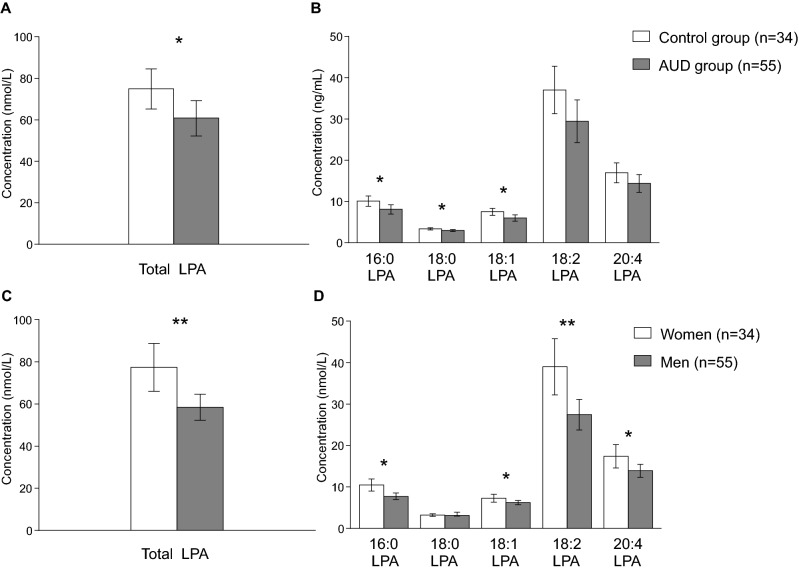
Figure 1.
Plasma concentrations of LPA species in the sample according to the group and sex. (A) Bars are estimated marginal means and 95% confidence intervals (95%) representing total LPA (nmol/L) according to the group; (B) bars are estimated marginal means and 95% confidence intervals (95%) representing LPA species (nmol/L) according to the group; (C) bars are estimated marginal means and 95% confidence intervals (95%) representing total LPA (nmol/L) according to the sex; (D) bars are estimated marginal means and 95% confidence intervals (95%) representing LPA species (nmol/L) according to the group. Data were analyzed by two-way analysis of covariance (ANCOVA) and *p < 0.05 and **p < 0.010 denote a significant main effect of group factor or sex.

