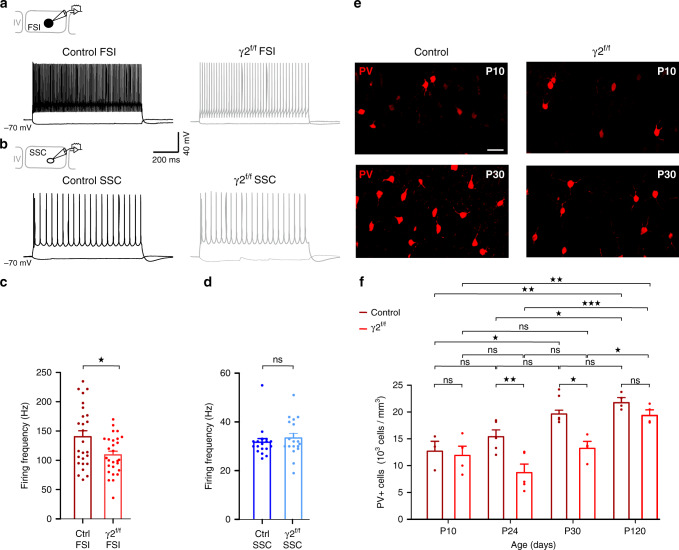
Fig. 4. FSI firing frequency and PV expression maturation in control and γ2f/f mice.
a, b Current clamp recordings of FSI (a) and SSCs (b) held at −70 mV during injections of 200 pA and −50 pA in control and γ2f/f mice. Note the decreased firing frequency of FSI but not of SSC in the mutant. c, d Dot plots of the frequency of action potential discharges of FSI (c) and SSC (d) in control (dark red and dark blue) and γ2f/f (light red and light blue) mice (n = 26 and n = 28 for FSI from N = 8 control mice and N = 7 γ2f/f mice, respectively; n = 18 for SSCs from N = 3 control mice and N = 3 γ2f/f mice; p = 0.0108 for (c), two-tailed Student’s t test; p = 0.3987 for (d), two-tailed Mann–Whitney test). e Representative confocal images of PV+ interneurons (red) in control and γ2f/f mice at P10 and P30. Scale bar: 40 µm. f Quantification of PV+ cell densities in control (dark red) and γ2f/f mice (light red) at P10, P24, P30, and P120. Note that the increase in PV expression observed from P10 to P30 in controls is delayed and detected at P120 in γ2f/f mice. Indeed, the number of PV+ interneurons is different between control and γ2f/f mice at P24 and P30 (P10: N = 3; P24: N = 5; P30: N = 5; P120: N = 4 for controls and P10: N = 4; P24: N = 5; P30: N = 4; P120: N = 4 for γ2f/f mice; p = 0,8421, p = 0.0230, and p = 0.0019 in control mice and p = 0.6270, p = 0.9934, p = 0.0068 in γ2f/f mice for comparison of P10 with P24, P30, and P120, respectively; p = 0,2163 and p = 0.0176 in control mice and p = 0.1982 and p < 0.0001 in γ2f/f mice for comparison of P24 with P30 and P120, respectively; p = 0,8781 in control mice and p = 0.0419 in γ2f/f mice for comparison of P30 with P120; p > 0.9999, p = 0.0091, p = 0.0252, p = 0.8902 for comparisons between control and γ2f/f mice at P10, P24, P30, and P120, respectively; two-way ANOVA test followed by a Tukey’s multiple comparison post hoc test). Dot plots in (c–f) are presented as mean±s.e.m, dots in (c) and (d) represent data from individual FSI and SSCs, respectively, and dots in (f) represent data from individual mice.

