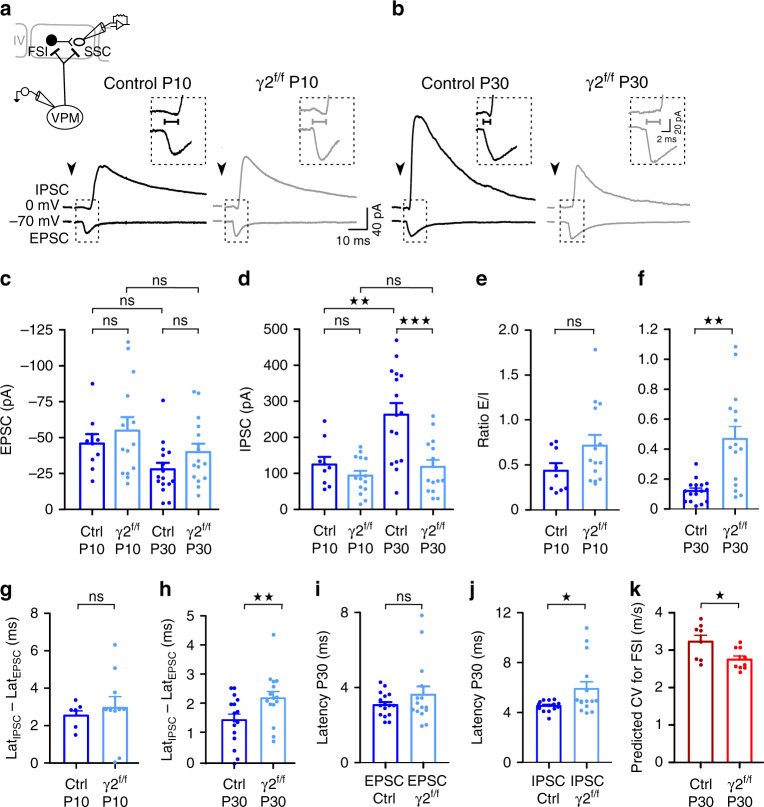
Fig. 5. Impaired IPSC latency and strength of layer IV SSCs in γ2f/f mice.
a, b Evoked EPSCs (bottom trace) and IPSCs (top trace) in layer IV SSCs held at −70 mV and −0 mV, respectively, in young (a) and mature (b) circuits upon thalamic stimulation in control (black) and γ2f/f (gray) mice. Note that the delay between IPSC and EPSC latencies decreases at P30 in control but not in the mutant (lines in insets). Stimulation artifacts blanked, stimulation time indicated (arrowheads). c, d Dot plots of EPSCs (c) and IPSCs (d) of layer IV SSCs evoked by thalamocortical stimulation at P9-P11 (referred as P10) and P21-P30 (referred as P30) in control (dark blue) and γ2f/f mice (light blue) (n = 9 and n = 14 at P10, n = 16 and n = 15 at P30 from N = 3 mice per condition; for EPSCs: p = 0.8443 for P10, p = 0.4428 for P30 between controls and γ2f/f mice; p = 0.3707 for controls, p = 0.6511 for γ2f/f mice between P10 and P30; for IPSCs: p = 0.8399 for P10, p = 0.0025 for P30 between controls and γ2f/f mice; p = 0.0025 for controls, p = 0.8715 for γ2f/f mice between P10 and P30; one-way ANOVA test followed by a Tukey’s multiple comparison test). e, f Dot plots of E/I ratio calculated from EPSCs and IPSCs obtained at P10 and P30 for SSCs in control (dark blue) and γ2f/f mice (light blue) (n = 9 and n = 14 at P10, n = 16 and n = 15 at P30 from N = 3 mice per condition; p = 0.1139 for (e), p = 0.001 for (f); two-tailed Mann–Whitney U test). g, h Dot plots of the delay between IPSCs and EPSCs latencies (LatIPSCs-LatEPSCs) at P10 (g) and P30 (h) in control (dark blue) and γ2f/f mice (light blue) (n = 8 and n = 10 at P10, n = 16 and n = 15 at P30 from N = 3 mice per condition; p = 0.7396 for (g), p = 0.0076 for (h); two-tailed Mann–Whitney U test). i, j Latencies of EPSCs (i) and IPSCs (j) at P30 for the same cells in (b) in control (dark blue) and γ2f/f mice (light blue) (n = 16 and n = 15 at P30 from N = 3 mice per condition; p = 0.8587 for (I), two-tailed Mann–Withney U test; p = 0.0153 for (j); two-tailed Student’t test). k Predicted conduction velocity of FSI in control (dark red) and γ2f/f mice (light red) (n = 8 cells from N = 5 control mice, n = 9 cells from N = 3 γ2f/f mice reconstructed in Fig. 1; p = 0.026; two-tailed Mann–Whitney U test). Dot plots in (c–k) are presented as mean±s.e.m, dots from (c–j) represent data from individual SSCs, dots in (k) represent data from individual FSI.

