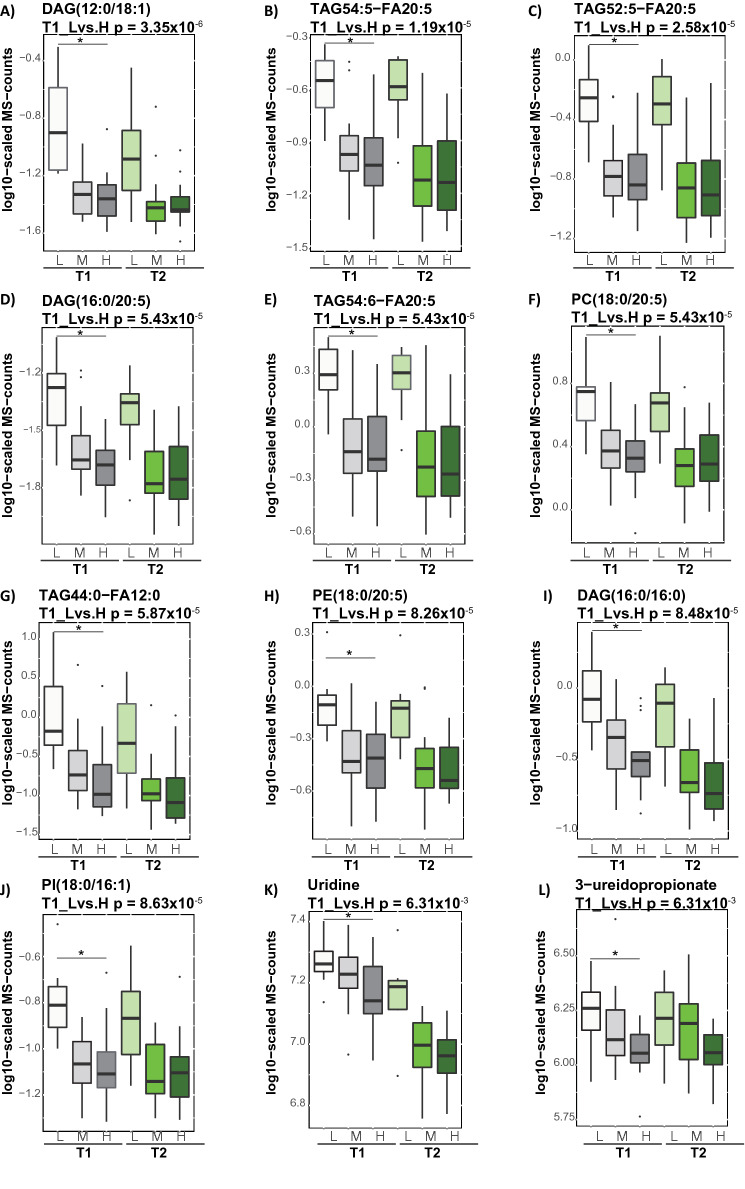
Figure 3.
Triacylglycerols and diacylglycerols differentiate subjects with low IS level in the fasting state. Box blots presents top ten metabolites showing significant association with the levels of IS. The p-value was defined by the statistical contrast between estimated metabolite levels and IS [low (L) and high (H)] at subjects’ baseline (T1), depicted by “*”. Gray and green color gradient indicate metabolite levels after overnight fasting and hyperinsulinemic-euglycemic clamp, respectively. Light color tone indicate subjects with low IS and dark color tone indicate subjects with high IS.

