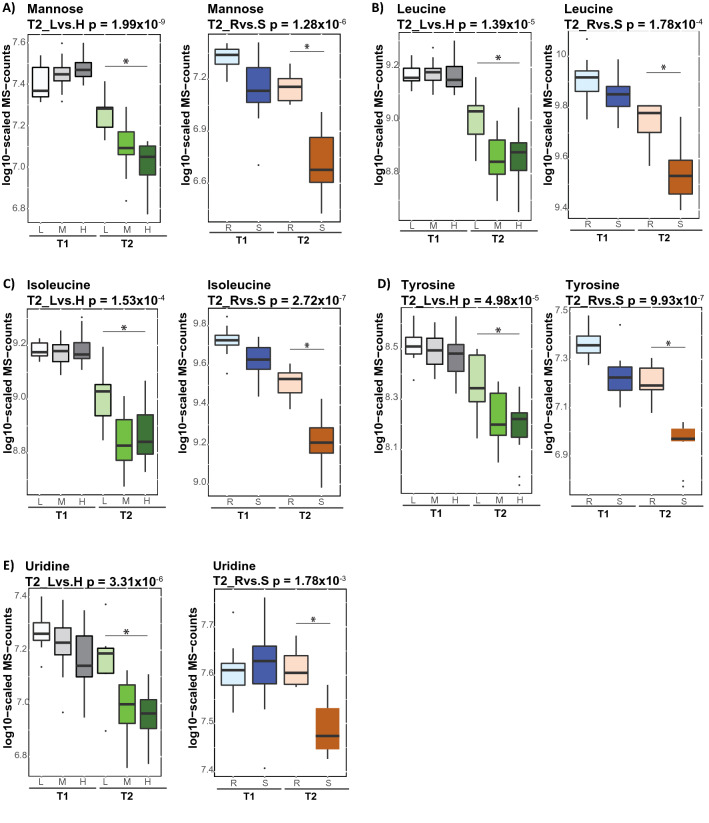
Figure 4.
Different metabolic responses to insulin under hyperinsulinemic-euglycemic clamp in clinically healthy subjects replicate in independent cohort consist of T2D (A–E). Box blots presents metabolites showing FDR significantly different responses to HIEC, associated with the levels of IS. The p-value was defined by the statistical contrast under hyperinsulinemic-euglycemic clamp (T2), between estimated metabolite levels and IS [low (L) and high (H)] in clinically healthy or between estimated metabolite levels and insulin-resistance/insulin-sensitive group in replication cohort of T2D. Gray and green color gradient indicate metabolite levels after overnight fasting and hyperinsulinemic-euglycemic clamp, respectively. Light color tone indicate subjects with low IS and dark color tone indicate subjects with high IS. The replication cohort is depicted by blue (fasting-state) and orange (at HIEC) color. Light blue—insulin resistant (R), dark blue—insulin-sensitive (S), light orange—insulin resistant (R), dark orange—insulin sensitive (S).

