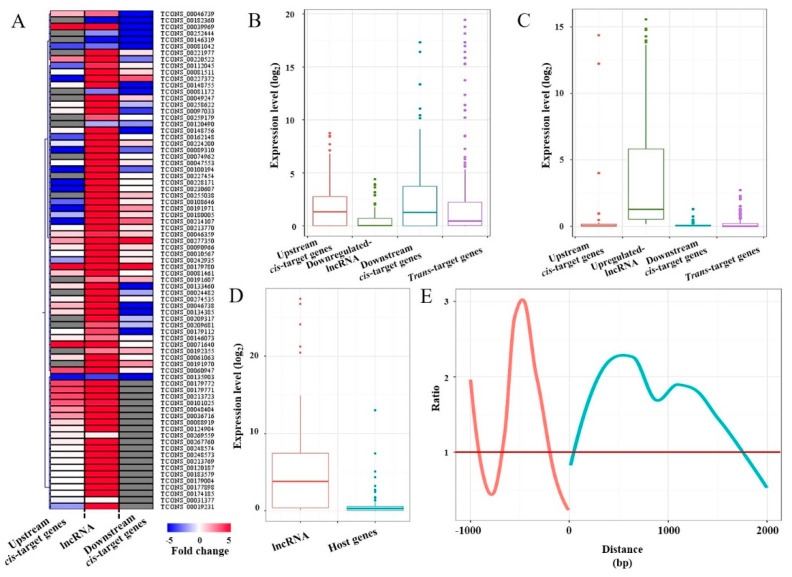
Figure 2.
Expression of high-temperature-responsive lncRNAs and neighboring genes: (A) heatmap of high-temperature-responsive lncRNAs and neighboring genes (fold change > 2, p < 0.01). Grey bands represent cases where no gene was detected. (B) Expression of downregulated lncRNAs and neighboring genes: horizontal lines represent median values, vertical lines represent minimum and maximum values, and dots represent outliers. (C) Expression of upregulated lncRNAs and neighboring genes: horizontal lines represent median values, vertical lines represent minimum and maximum values, and dots represent outliers. (D) Expression of lncRNAs and host genes: horizontal lines represent median values, vertical lines represent minimum and maximum values, and dots represent outliers. (E) Trend in lncRNA and neighboring gene transcript abundance over distance.

