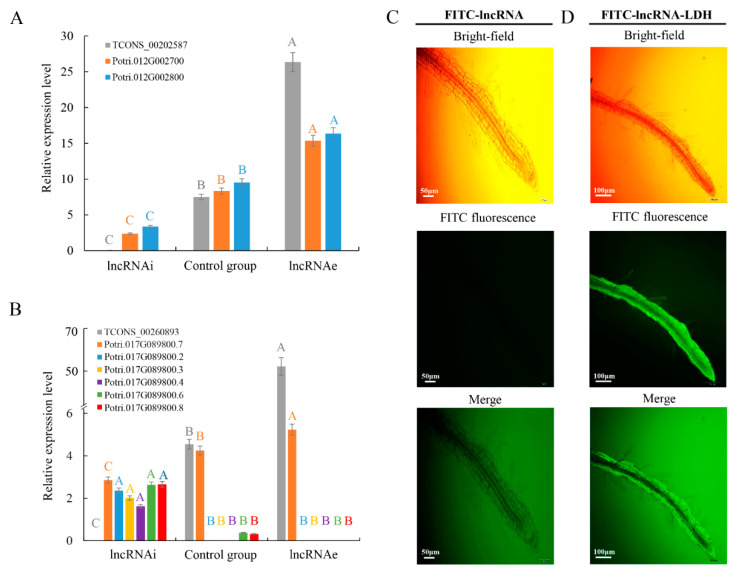
Figure 3.
Expression of lncRNA and targets under lncRNAi and lncRNAe treatment: (A) expression pattern of TCONS_00202587 and its cis target genes (Potri.012G002700 and Potri.012G002800) and (B) expression of TCONS_00260893 and transcripts of different targets. Relative transcript levels were calculated by real time PCR with ACTIN as the standard. Data are mean ± SE of three separate measurements. Error bars represent standard error. Significantly different genes among the control group, lncRNAi, and lncRNAe were determined using Fisher’s least significant difference (LSD) test. Different colored letters on error bars indicate significant differences in the genes corresponding to that color among the groups at p < 0.01. (C) Fluorescence microscopy of intact poplar root cells after 3 h treatment with fluorescein 5-isothiocyanate (FITC)-lncRNAs and washing. Scale bars = 50 μm. (D) Fluorescence microscopy of intact poplar root cells after 3 h treatment with FITC-lncRNAs-LDH and washing. Green represents the fluorescence of LDH-lactate-NS-lncRNA-FITC from the cytosol of poplar root cells, indicating that LDH-lactate-NS delivered synthetic lncRNAs into intact roots. Scale bar = 100 μm.

