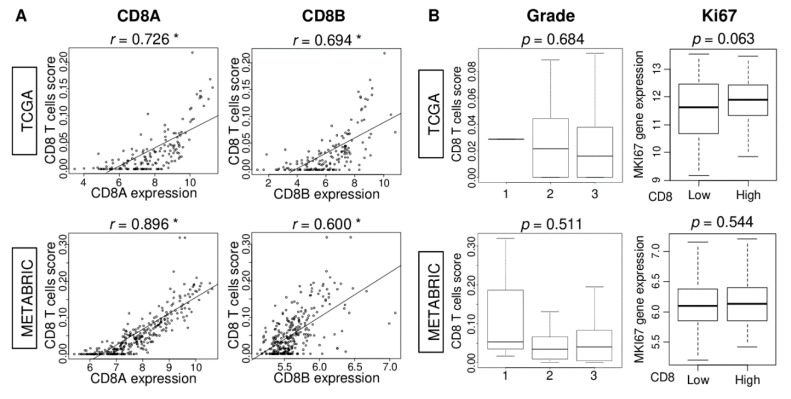
Figure 3.
Association of CD8 T cells score with CD8A and CD8B gene expression and clinical aggressiveness of TNBC in TCGA and METABRIC cohorts. (A) Correlation between CD8 score and CD8A and CD8B gene expressions in TNBC of both cohorts. Spearman correlation statistics is used for the analysis. * p < 0.01. (B) Boxplots of the CD8 T cells score by Nottingham pathological grade, and comparisons between low and high CD8 score group with MKI67 gene expression of TNBC in both cohorts. One-way ANOVA was used to calculate p value.

