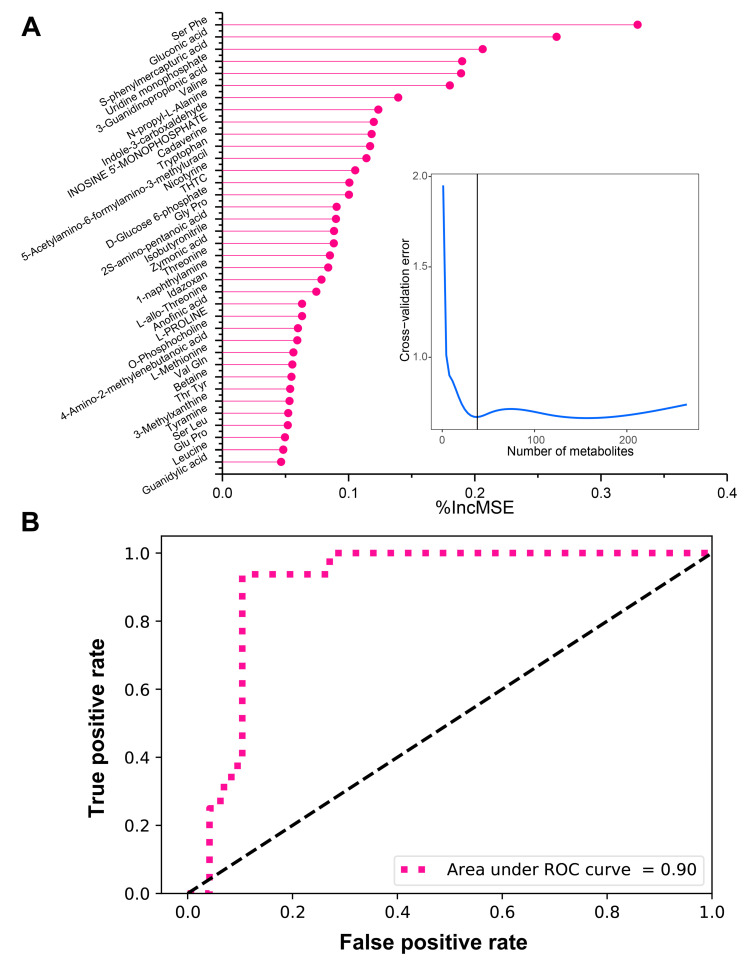
Figure 3.
Potential biomarker screening by the random forest regression model. (A) Dot plot represents the top 37 metabolic biomarkers identified by using random forest regression. The metabolic biomarkers are ranked in descending order of the percent increase in mean square error (%IncMSE). The insert line plot represents 10-fold cross-validation with ten repeats that evaluates the importance of metabolites. The minimum cross-validation error was obtained when using 37 important metabolites; (B) receiver operating characteristic (ROC) curve of the potential metabolic biomarkers identified by the random forest regression model. The random forest model achieved a higher area under the ROC curve (AUC) of 0.90, indicating the excellent performance of the constructed model using the random forest method.

