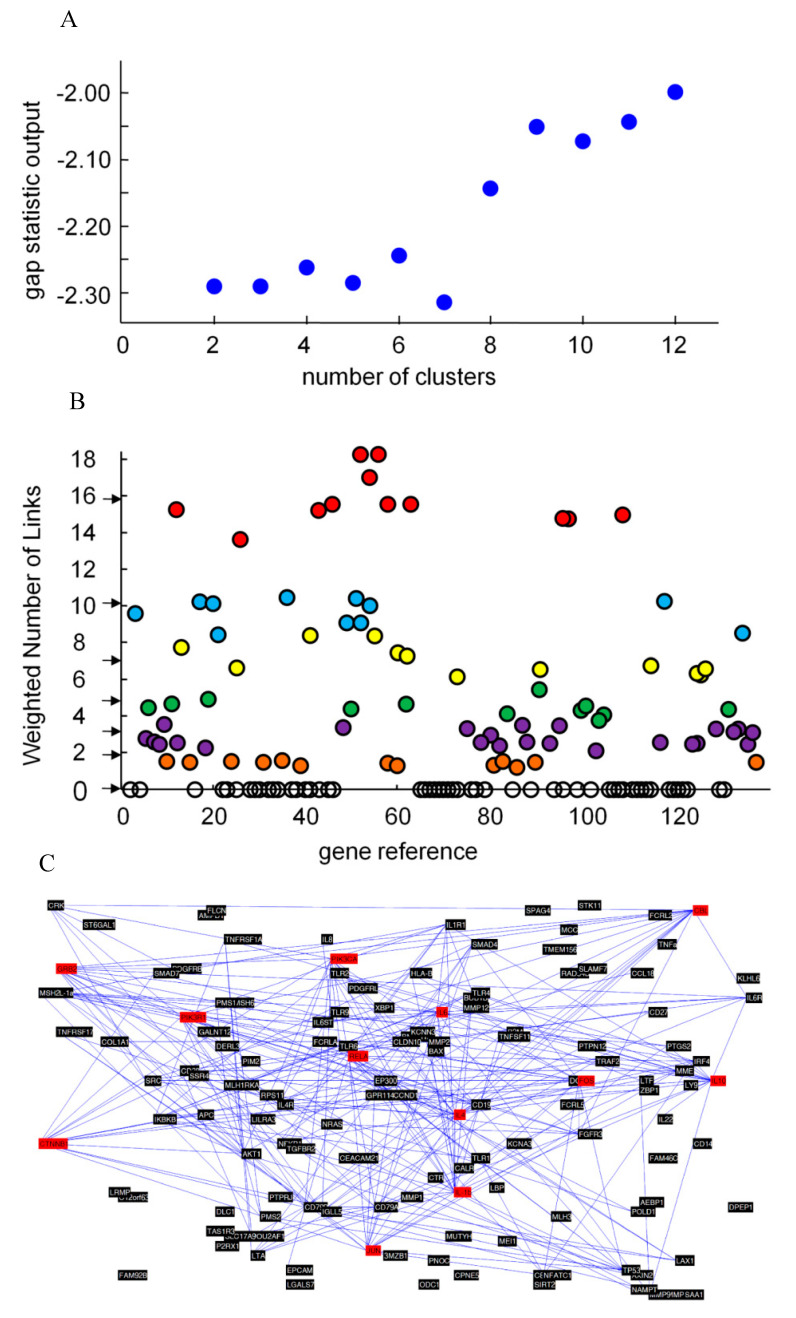
Figure 2.
A–C. Data analysis for colorectal cancer and periodontal disease: (A) plot of the gap statistic method for estimating the number of clusters; (B) WNL for genes involved in the phenomenon. Black arrows are the centroids of the cluster groups: leader genes (in red); cluster B genes (in light blue); cluster C genes (in yellow); cluster D genes (in green); cluster E genes (in purple); cluster F genes (in orange); and ‘orphan’ genes (in clear); (C) final map of interactions of 137 genes involved in the genetic linkage between periodontitis and CRC according to STRING: leader genes are red; the lines that connect single genes represent predicted functional associations among proteins in the confidence view.

