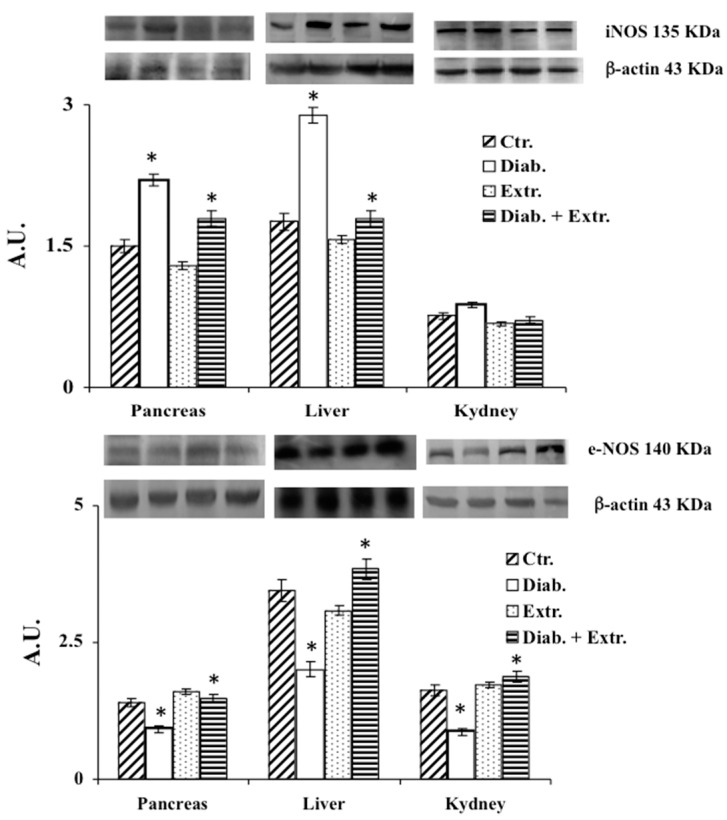
Figure 6.
Immunoblotting of iNOS and eNOS expression in tissue of control rats (Ctr.), diabetic rats (Diab.), non-diabetic rats treated with B. etnensis extract (Extr.) and diabetic rats treated with B. etnensis extract (Diab. + Extr.). Values, expressed as Arbitrary Units, represent the mean + D.S. of four experimental determinations (10 samples/group). * p < 0.001 vs. Ctr and vs. Diab.

