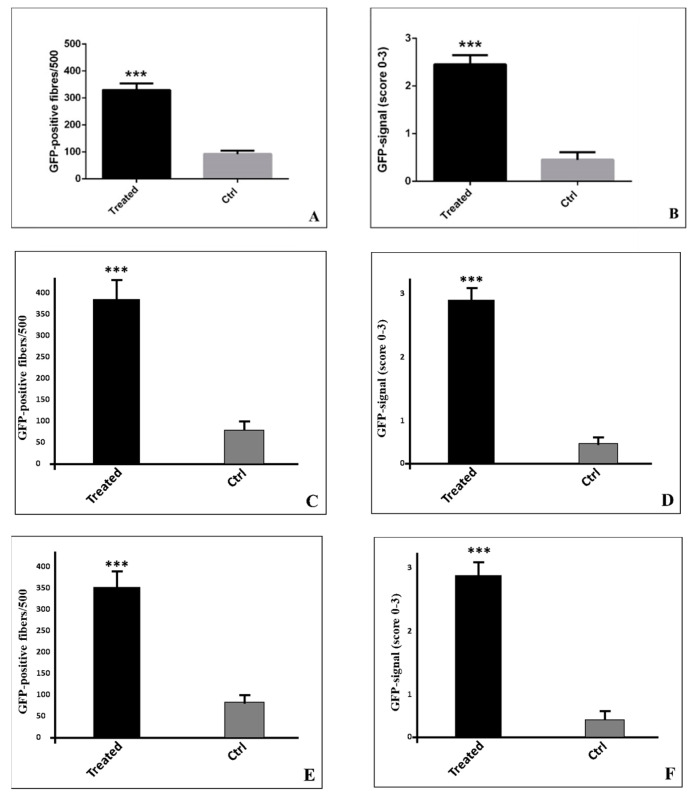
Figure 1.
Evaluation of the GFP (Green Fluorescent Protein) signal in skeletal muscle fibers. (A) Graph shows the number of GFP-positive muscle fibers in the treated and control groups (α = 0.05) at day 4. (B) Graph displays the GFP signal intensity in the treated and control groups (α = 0.05) at day 4. (C) Graph shows the number of GFP-positive muscle fibers in the treated and control groups (α = 0.05) at day 10. (D) Graph displays the GFP signal intensity in the treated and control groups (α = 0.05) at day 10. (E) Graph shows the number of GFP-positive muscle fibers in the treated and control groups (α = 0.05) at day 15. (F) Graph displays the GFP signal intensity in the treated and control groups (α = 0.05) at day 15. Asterisks indicate a significant difference between values.

