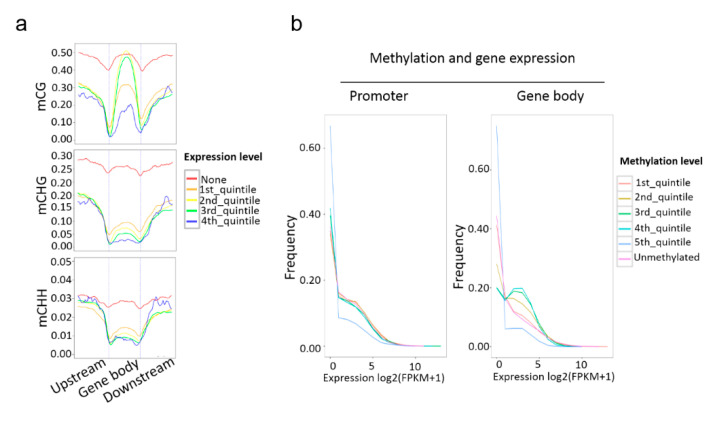
Figure 3.
Relationship between DNA methylation and gene expression. (a) Distributions of methylation levels within gene bodies partitioned by different expression levels: 1st_quintile is the lowest and 4th_quintile is the highest; genes with FPKM value < 0.1 were considered non-expressed (none); (b) expression profiles of methylated genes compared with unmethylated genes. Methylated genes were further divided into quintiles based on promoter and gene body region methylation levels: 1st_quintile is the lowest and 5th_quintile is the highest.

