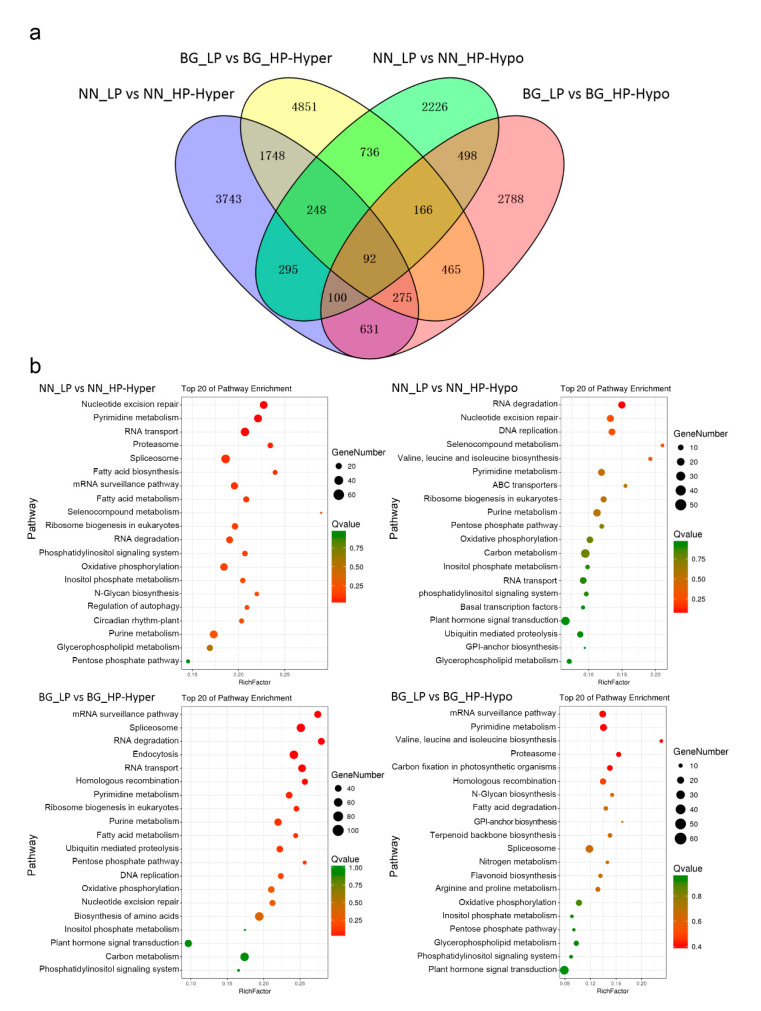
Figure 4.
Differential methylome analysis under low-P stress. (a) Venn diagram of hyper/hypomethylated genes among ‘Nan-nong94-156′ and ‘Bogao’ under low-P stress; (b) KEGG pathway enrichment of hypermethylated and hypomethylated genes in two cultivars under low-P conditions. The size of the circle represents gene numbers, and the color represents the q-value. NN_LP vs. NN_HP, ‘NN’ low-P versus high-P; BG_LP vs BG_HP, ‘BG’ low-P versus high-P.

