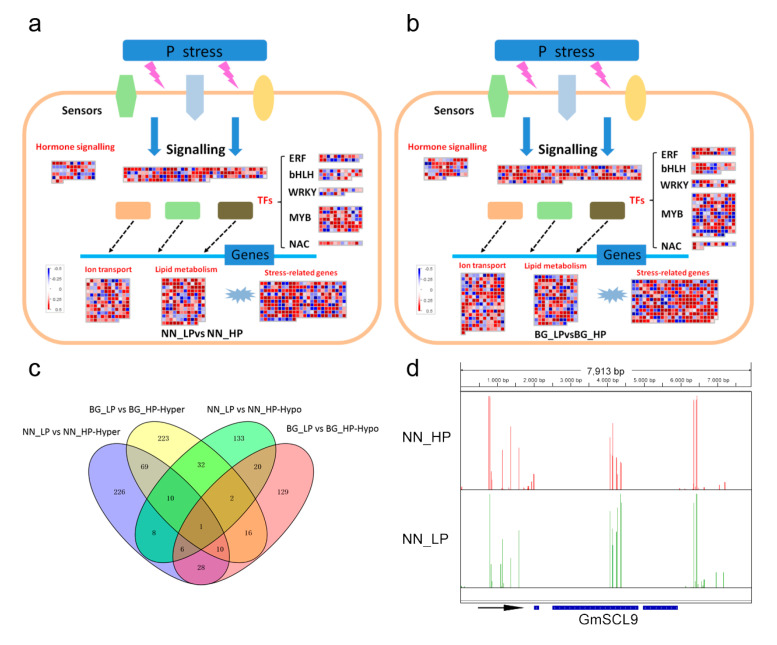
Figure 5.
Assignment of differentially methylated genes among ‘Nan-nong94-156′ (a) and ‘Bogao’ (b) under low-P stress in Mapman bins. The red and blue squares indicate the hyper- and hypomethylated genes, respectively. Other different shaped graphics with different colors refer to some sensors and transcription factors (TFs) responding to low-P stress. (c) Venn map of differentially methylated transcriptional factors; (d) IGV software depicts the hypermethylation of GmSCL9 gene body region induced by low-P stress in ‘Nan-nong94-156′. NN_LP vs NN_HP, ‘NN’ low-P versus high-P; BG_LP vs BG_HP, ‘BG’ low-P versus high-P.

