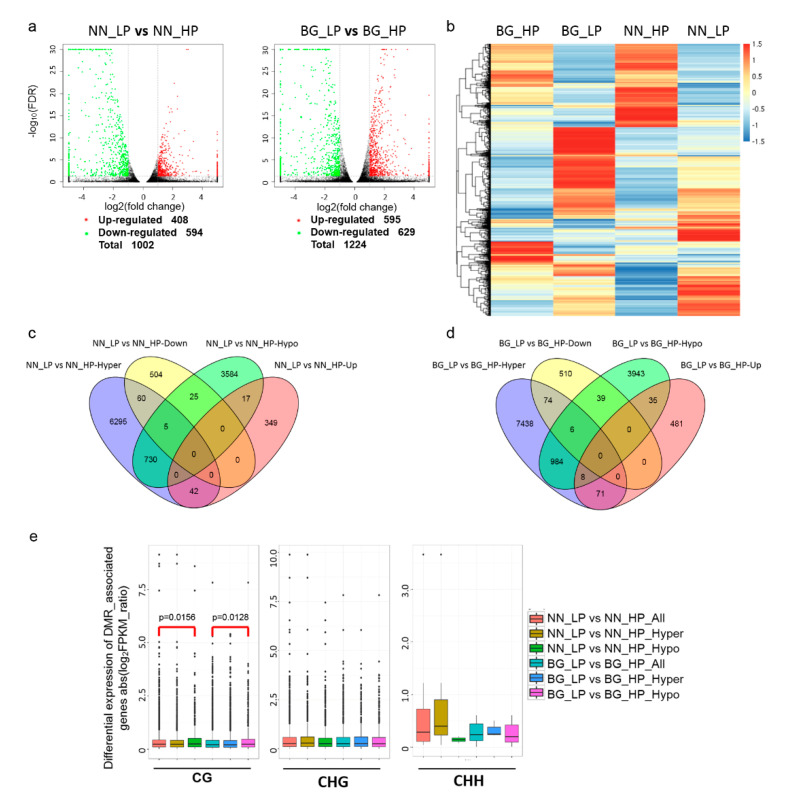
Figure 7.
The effect of methylation changes on transcriptional alterations. (a) Differentially expressed genes (DEGs) in ‘Nan-nong94-156′ or ‘Bogao’ in response to low-P stress. Each dot represents one gene. The red dots represent upregulated genes and the green dots represent downregulated genes. The black dots represent genes without differential expression. The X-axis is the log2 value of fold change and the Y-axis is the log10 value of false discovery rate (FDR); (b) heat maps of DEGs. NN_HP, ‘Nan-nong94-156′ under control conditions; NN_LP, ‘Nan-nong94-156′ under low-P conditions; BG_HP, ‘Bogao’ under control conditions; BG_LP, ‘Bogao’ under low-P conditions. Venn diagram of DMGs (differentially methylated genes) and DEGs in NN_LP vs NN_HP (c) and BG_LP vs BG_HP (d); (e) differential expression levels of all genes (red box), hypermethylated genes (green box), and hypomethylated genes (blue box) among NN_LP vs NN_HP and BG_LP vs BG_HP in three sequence contexts (CG, CHG, and CHH) are displayed as boxplots (boxes represent the quartiles; Wilcoxon P values are reported). NN_LP vs NN_HP, ‘NN’ low-P versus high-P; BG_LP vs BG_HP, ‘BG’ low-P versus high-P.

