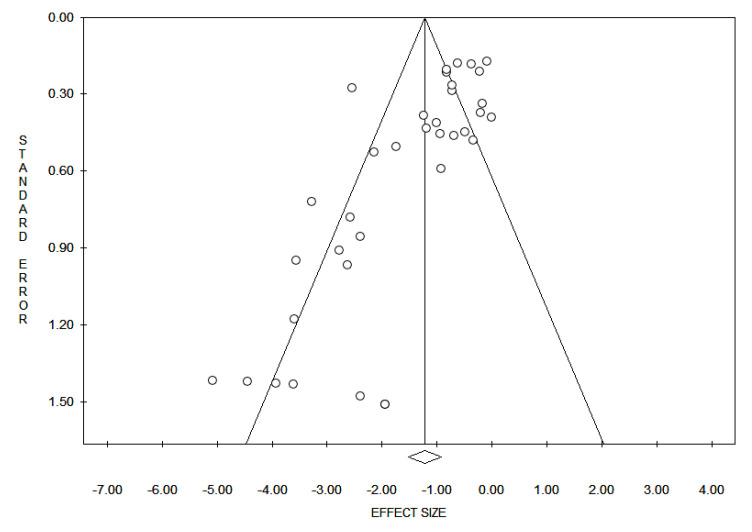
Figure 1.
Funnel plot for evaluation of bias across studies: The x-axis in the present analysis is the Wilms’ tumor 1 (WT1) expression and the y-axis is the standard error. In the absence of bias, a funnel plot should be a symmetrical inverted funnel. In the presence of bias, smaller studies with no expression would be missing, thus creating an asymmetrical funnel. Asymmetry in a funnel plot suggests that there is a systematic difference between larger and smaller studies and/or that there is publication bias.

