Figure 1.
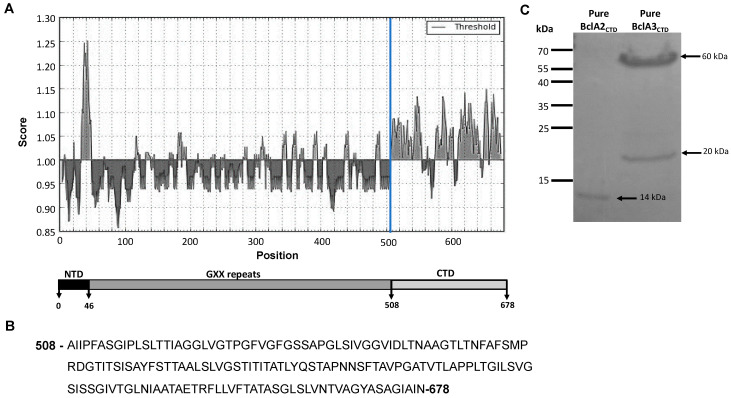
Analysis of the glycoprotein BclA3 from C. difficile R20291. (A) The C-terminal domain (CTD) of BclA3 (last 170 amino acid residues) shows higher B cell epitope propensity score compared with the rest of the protein (Kolaskar & Tongaonkar Antigenicity Method from Immune epitope database). The X- and Y-axes represent the sequence position and antigenic propensity score, respectively. The threshold value was generated by default by Immune epitope database (http://tools.iedb.org/bcell/). The regions above the threshold are antigenic. (B) The correspondent aminoacidic sequence of BclA3CTD is shown. (C) Coomassie stained SDS-PAGE gel; 2 and 5 µg of purified C-terminal domains of the exosporium proteins BclA2 and BclA3 were loaded, respectively. BclA2CTD migrates as 14 kDa band while BclA3CTD migrates as 2 bands of approximately 20 and 60 kDa.

