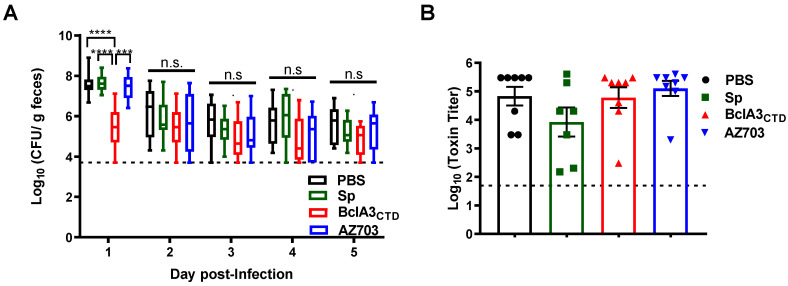
Figure 6.
Analysis of spore load in feces and cecal toxin titers. (A) The load of C. difficile spores in the feces was evaluated on the following 5 days after infection as log10 Colony Forming Unit (CFU)/g of feces. (B) The cecum content toxicity was measured and represented as log10 toxin titer. Two-way ANOVA Tukey’s multiple comparisons test in A and Mann–Whitney non-parametric tests in B were used; Statistical differences (p < 0.05) are indicated by asterisks. *** p < 0.001 and **** p < 0.0001. The bars are the geometric mean ± standard error of the mean. No significance (n.s).

