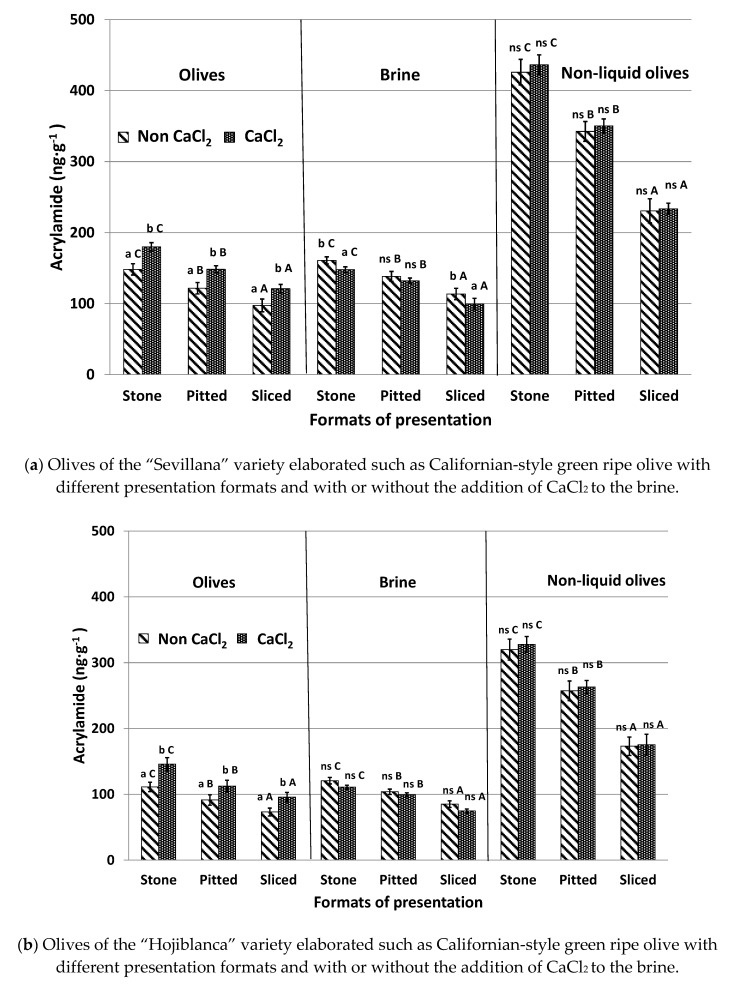
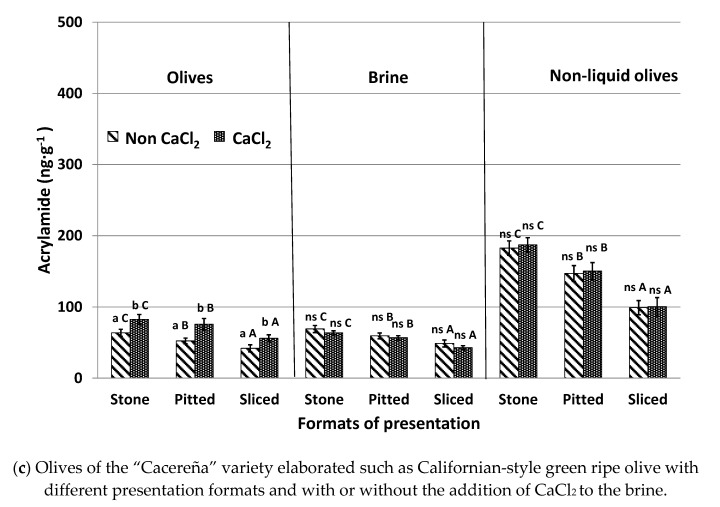
Figure 4.
Acrylamide content (ng g−1) of olives and brine obtained from different olive presentation formats (stones, pitted, sliced), with or without the addition of CaCl2 to brine after the sterilization process. Results are expressed as means ± SD of five sample replicates. Superscript indicates statistically significant differences relating to CaCl2 addition (Tukey test, p < 0.05). Different capital letters in the same columns indicate statistically significant differences between different olive presentation formats (Tukey test, p < 0.05). ns: no significant differences.


