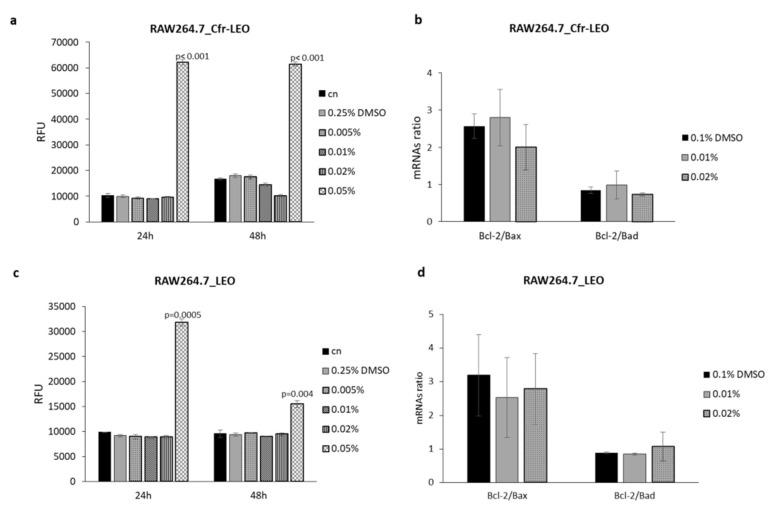
Figure 2.
Evaluation of murine macrophage cytotoxicity after Cfr-LEO and LEO exposure. (a) RAW264.7 cell cytotoxicity was measured by CellTox Green Cytotoxicity Assay after 24 and 48 h of treatment with different concentrations of Cfr-LEO (0.005%, 0.01%, 0.02%, 0.05%). Values are plotted as Relative Fluorescence Unit (RFU). Values are the mean ± SD of two biological replicates, each carried out in technical duplicates. The statistical significance of the differences between two groups (cells treated with 0.05% of Cfr-LEO Vs cn) was analyzed using a two-tailed Student’s t-test. (b) The effects of Cfr-LEO treatment (0.01%, 0.02%) on Bcl-2, Bax and Bad transcription were assessed by qRT-PCR. Data are represented as Bcl-2/Bax and Bcl-2/Bad ratio. Values are the mean ± SD of two biological replicates. (c) RAW264.7 cell cytotoxicity was measured by CellTox Green Cytotoxicity Assay after 24 and 48 h of treatment with different concentrations of LEO (0.005%, 0.01%, 0.02%, 0.05%). Values are plotted as Relative Fluorescence Unit (RFU). Values are the mean ± SD of two biological replicates, each carried out in technical triplicates. The statistical significance of the differences between two groups (cells treated with 0.05% LEO Vs cn) was analyzed using a two-tailed Student’s t-test. (d) The effects of LEO treatment (0.01%, 0.02%) on Bcl-2, Bax, and Bad transcription were assessed by qRT-PCR. Data are represented as Bcl-2/Bax (two biological replicates) and Bcl-2/Bad (three biological replicates) ratio.

